Tax Rates, Inequality, and US Deficits – Barry Ritholtz. Sometimes no one nails it like Barry.
Its Friday, after what was for me a long and annoying 17 days. But the shutdown is over, US markets are at all time highs, and Bob Shiller got his Nobel (more on this tomorrow).
You might think that I would be at peace with the current state of the world, but life is never that simple. You see, I have assumed the task of explaining things which require explaining. By some quirk of fate and an odd academic background, I find myself with skills in simplifying complex matters. Whether OCD or over-compensation for some other defect, this is my lot in life. (I made peace with it long ago).
As we discussed yesterday, amongst all of the background nonsense since October 1, the noise about the deficits was not really about budget deficits at all. Rather, it was about a decidedly narrow ideology held by a small percentage of Americans. Their belief is that government should be much smaller. This is a legitimate political ideology, one that has persisted over the centuries.
Their approach to this philosophy, however, is far less intellectually honest. Rather than having a full on debate on that subject — a debate they are likely to lose — they have chosen a very different approach. This time around, they made the deficit a proxy.
Because of what I do for a living, I found this offensive. Deficits impact fixed income, an important part of portfolio planning. They impact available credit, capital for investment, in a broad and varied way. Hence, the deficit is a genuine issue, a real problem that should be addressed in a mature and responsible way. It can be easily solved using intelligent solutions, but for the ideologues in Washington DC (and elsewhere) who refuse to treat it as the basic mathematics and accounting problem it actually is. The way the Tea Party and others have treated the deficit reminds me of the approach Meredith Whitney took to Municipal Debt. Both groups are stunningly ignorant about their subjects, while possessing the skills to allow them to exploit the topic, hog the spotlight for themselves and other tangential pet issues.
The Tea Party, like Whitney, turned an important question of debt and credit and solvency into one giant PR clusterfuck.
Back to our issue of taxes (next week, I will address spending). Amongst Industrialized Nations, the United States has amongst the lowest tax rates in the world, especially for those folks (like myself) who reside at the top of the income scale.
To demonstrate this, I want to point to the IMF’s World Economic and Financial Surveys: Taxing Times. It is chock full f great charts and data and other interesting results of the IMF survey.
The two below caught my eye. They are rather instructive for our discussion of taxes and deficits in the US.
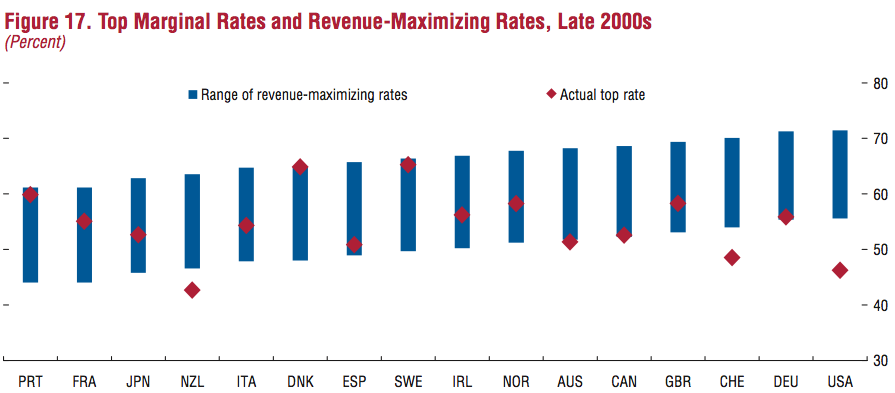
The first looks at major industrial nations, and compares what the IMF calls their Revenue-Maximizing Tax Rates (blue line) versus their actual top rate (red dot).
As you can see, some countries — Denmark and Sweden — are at the top of the revenue maximizing ranges. Other countries — Canada and Germany — are at the bottom of their revenue maximizing ranges.
Then there is the United States, which is simply far off the scale, way below the bottom of its revenue maximizing range.
If your concern is deficits, than you must take notice of how much money the USA is leaving on the table. I am not suggesting that the role of government should be to maximize their tax revenues, but rather to suggest that if you want to close the deficit, you need to at least be in a defendable range. The US is not.
click for ginormous charts
Source: IMFNot coincidentally, when we look at shares of Net Wealth held by the bottom 50% of he population versus the top 10%, the United States is off the scale. We are the most unequal nation in the world.
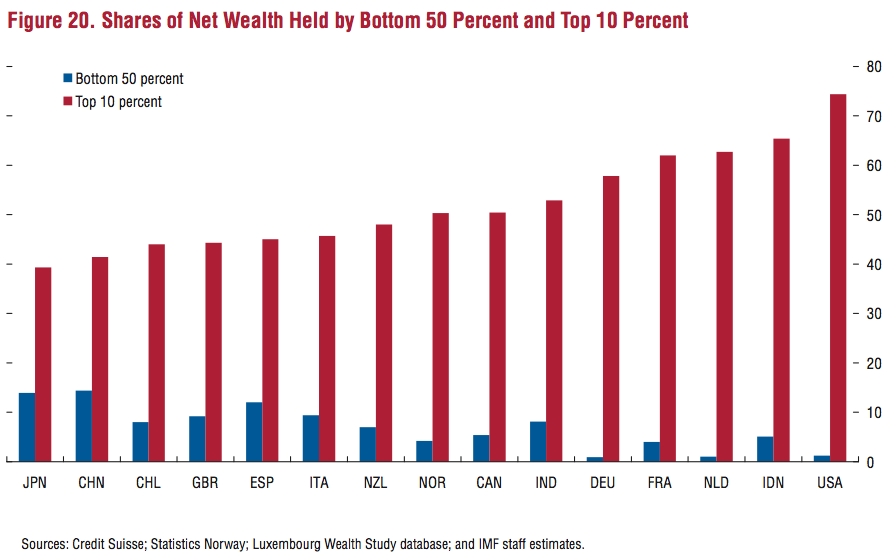
Source: IMFThe inescapable conclusion presented to us by this data is that our tax policy is responsible for both the world’s greatest inequality among developed nations, and our ongoing deficits.
If you have a better explanation for our current conditions, or the net results of our tax policies, I would love to hear it.
Source:
Fiscal Monitor Taxing Times
World Economic and Financial Surveys
IMF October 2013
http://www.imf.org/external/pubs/ft/fm/2013/02/fmindex.htm
Did Monetary Policy Cause the Recovery? – John Hussman. A very nice demolition of our monetary policy charade for Janet Yellen to consider. Let’s hope she has the guts to make some heads roll [i.e., to bring back honest accounting].
[…] To address this question, a proper understanding of the credit crisis is essential. Much of the present faith in monetary policy derives from the belief that it was the central factor in ending the banking crisis during what is often called the Great Recession. On careful analysis, however, the clearest and most immediate event that ended the banking crisis was not monetary policy, but the abandonment of mark-to-market accounting by the Financial Accounting Standards Board on March 16, 2009, in response to Congressional pressure by the House Committee on Financial Services onMarch 12, 2009. The change to the accounting rule FAS 157 removed the risk of widespread bank insolvency by eliminating the need for banks to make their losses transparent. No mark-to-market losses, no need for added capital, no need for regulatory intervention, recievership, or even bailouts. Misattributing the recovery to monetary policy has contributed to a faith in its effectiveness that cannot even withstand scrutiny of the 2000-2002 and 2007-2009 recessions, and the accompanying market plunges. This faith is already wavering, but the loss of this faith will be one of the most painful aspects of the completion of the present market cycle. […]
The simple fact is that the belief in direct, reliable links between monetary policy and the economy - and even with the stock market - is contrary to the lessons from a century of history. Among the many things that are demonstrably nottrue - and can be demonstrated to be untrue even with simple scatterplots - are the notions that inflation and unemployment are negatively related over time (the actual correlation is close to zero and slightly positive), that higher inflation results in lower subsequent unemployment (the actual correlation is positive), that higher monetary growth results in subsequent employment gains (the correlation is almost exactly zero), and a wide range of similarly popular variants. Even "expectations augmented" variants turn out to be useless. Examining historical evidence would be a useful exercise for Econ 101 students, who gain an unrealistic sense of cause and effect as the result of studying diagrams instead of data.
No comments:
Post a Comment