Showing posts with label interest rates. Show all posts

Thursday, May 8, 2014

Interest rate reality check

There is a lot of talk about when “the Fed” is going to “raise rates.” Rates are actually determined mostly by supply and demand in the money market. Without getting into an academic fracas, I am going to present some graphs representing very strong empirical regularities that suggest interest rates, long or short, are not going up any time soon.

I’ve presented one of these before, the long term chart; here I’ve added the 3-month T-bill. These graphs show the relationship between interest rates and the ratio of the St. Louis monetary base to GDP. Data is to April or first quarter 2014. The ratio of base to GDP is ~0.23 currently.

image

image

Here is the trajectory of the base/GDP ratio. Can you spot the taper?

image

Here is the trajectory of base:

image

From these empirical regularities I draw the following conclusions:

  • Interest rates aren’t going up any time soon. The “taper” is really a reduction in the rate of addition to base, not a reduction of base.
  • Nor is inflation taking off any time soon, except for stagflationary cost-push. Negative real interest rates will continue. The labor market has no power; the reserve army of the unemployed (whether they are categorized as such or “not in the labor force”) is growing. There is no wherewithal for a wage-price spiral to get started.

This mirrors the experience of the Thirties. ZIRP in that period lasted until near the end of WWII. It took a war to get the inflation started. Federal debt exploded. But America had relatively less sovereign debt going into that war; we are already at comparable levels.

So people who suggest that the Fed “raise interest rates” are really asking the Fed to reduce the size of the monetary base a huge amount. There is no question the Fed would crash the stock market if they did this, purely because of the “optics,” so it won’t happen. Moreover, if the Fed sent all those bad debts back into the banking system they’d be subject to “stress testing” (heaven forbid they were actually marked to market) that I somehow doubt the Fed does on the stuff they hold. (Comment if you know better than I, please.)

Plutocracy World, the Global Casino, rocks on for years to come. The banking system hangs like an albatross around the neck of the world economy. China seems to be making the same mistakes; it will be interesting to see what they do with all their bad debt.

The great economic task of the first half of the twenty-first century will be to reform the world’s monetary system.

Thursday, March 20, 2014

Fiat money = funny money => Fed must screw labor

h/t Mish for pointing out an article by Adair Turner, former Chairman of the United Kingdom’s Financial Services Authority, a member of the UK’s Financial Policy Committee and the House of Lords, suggesting that the Fed or any fiat money central bank might accept conversion of assets on its balance sheet, i.e., Treasuries, into zero coupon perpetuities, and so create "helicopter money" and permanent monetization of the sovereign debt.

I suggested just this strategy as a joke some time ago (here).

However, we all knew that the Fed can and does print money. But stating it as baldly as this brings me back to the problem this causes in the labor market.

As I have said repeatedly, inflation (a sustained wage price spiral inflation) is always and everywhere a labor market phenomenon accommodated by monetary policy.

Thus, with the vast overhang of base the Fed must worry about inflation in the long run, even if not so much right now. Why not now? Because prosumers are overburdened with debt and inflation is nowhere raising its ugly head. Looking more deflationary now, it is.

But should actual deleveraging take place by some other means than a few bad debts actually being charged off (imagine that!), such as bad debts being recognized as such (FAS 157 thrown out, good riddance) and debtors finding relief as the (unpaid) debts hit statute of limitation dates with no more recourse--then the Fed would have to worry about a wage-price spiral getting going.

In other words, the Fed is intrinsically anti-labor and always will be. What did Paul Volcker teach us, if not that? You got to recruit some cannon fodder, some inflation fighters to win the war on inflation.

There's an interesting wrinkle in here in that Janet Yellen has allegedly stated her desire to see the labor force participation rate improve, while at the same time worrying that it will adversely impact the unemployment rate (duh!) and hence, confidence. (My readership is small but highly intelligent and knows that if discouraged workers are included the unemployment rate is well above 10 percent by the governement's own questionable figures.)

I do believe the Fed economists are aware of the psychological importance of the unemployment rate that the unknown economist whose work I channel has established, and which the econophysicists seem to appreciate far more than the professional economist (i.e., generally establishment cheerleaders) community does.

Sometime within the next few years the unemployment rate will meet its falling adaptation level and rise above it. That is when we will see the next collapse of confidence. So the model predicts.

In passing I note that MMT does not really offer a way out of the wage price spiral problem. They just seem to be willing to inflate the debt out, disco style. However, the danger of hyperinflation may be greater this time, given the size of the base, and they seem oblivious (to me) to the Austrian distributional implications that those who get new money first can increase their wealth at rates much faster than those depending on increasing real wages can expect.

To bing this discussion full circle, let's ask what comes next for the international monetary system? Does an IMF ADR basket currency make the central banks love labor any more? I think not. Unless they're playing competitive devaluation games, they still can't afford too much inflation ("a little inflation is a good thing, but not too much"--this is the mainstream cant).

Given the plutocratic distribution in the world today, it seems to me that any fiat money system broadly adopted is going to result in labor continually getting screwed, absent really aggressive incomes policies (guaranteed basic income and health care, for example; or even better, enforced limits on wage contours, now being challenged even in Sweden, such is the prevalence of greed in the current historical moment).

History shows that a metal based system achieves stable prices over long periods. Sorry, "Rich Dad, Poor Dad," you're not a genius for investing in real estate. To paraphrase Paul Samuelson, during an inflation every fool is a great financier. It takes no brains to load up on debt when inflation is guaranteed.

Are there financial crises under a metal standard? Yes, just like under fiat banking as it rides into its sunset. The answer to cyclical variations is always to let them happen, to concentrate on stabilizing people and not "the business cycle," to take care of displaced persons during the adjustment. And to keep banks out of the business of speculation with other people's money.


Monday, February 17, 2014

When will long rates rise?

Answer: After a whole lot of taper.

John Hussman has a famous graph of short rates plotted against the ratio of monetary base to GDP. I’ve never seen anyone plot the same for long rates, so I did it:

image

Recently Base/GDP has been about 0.22, so we are way out on the right end tail. It would take a reduction of the ratio of about 15 percent of GDP to begin to raise long rates, or about $2.6 trillion at current rates of GDP. The St. Louis base is currently at $3.7 trillion, and has been growing at over 20 percent a year since the last recession.

Friday, September 6, 2013

‘Animal spirits’ update: taper off

The downtick in unemployment raised the A metric marginally but its topping formation remains in place. The onset of the next crisis of confidence—the signature characteristic of the business cycle downturn--will probably come in 2014.

image

As I have pointed out before, ZIRP lasted from 1934 to 1946 last time and there’s no indication it will go away soon this time. There has been less banking reform, the debt load is greater, and the distribution is even more skewed. Here is Shiller’s long term bond rate data:

image

Note that from 1936 to 1946 the rate went down. Data is through 2013 YTD. We are still awaiting our 1937-38 analog slump.

Unless, of course, the fools running things manage to get a big war going soon.

The next big thing, especially if Summers gets in, will be crypto-MMT debt explosion as America leaders (ruling class) feather their nests with “infrastructure spending.” Saez and Picketty showed us what happened in to the last such “growth endeavor”: it went 93 percent to the top 1 percent.

Sucks, doesn’t it? Find a faith and practice it, and congregate with like-minded people. Stay away from psychopaths (and that means almost anyone at a senior level in a large corporation, nowadays, as they are shooting the zombies climbing up beneath them in the head to protect their positions).

Peace.

Friday, June 28, 2013

Coppock curve update

N.B.  The following is research, not investment advice.  You invest at your own risk, unlike the Wall Street banks, who also invest at your risk.

The Coppock curve is tracking downward.

image

image

The Coppock curve sends a long-term bottom signal when it turns up from a negative reading.  Assuming the curve does not bounce up again—anything is possible but it has only bounced from this low before once, in 2012—how long until the next major market bottom?  The mean number of months from a similar Coppock value ~67 to the next bottom (the signal in 2001 was the only false positive and is ignored, taking the second signal in 2002 as the true signal) was 11.6 months, with a max of 19 and a min of 5.

image

So the average expectation would be for a bottom in the summer of 2014, a very crude second degree polynomial fit to the the series of signal leads gives a lead time of ~8 months for a bottom in spring 2014, which has a certain harmonic resonance with the Seventies big bottom which was in March 1974.

By the way, long interest rates rose all the way up to the bottom in 1974—and beyond, of course.  However, if the world economy hits an air pocket (failure of effective demand) we could see stock prices falling and further disinflation or deflation.  Remember, the last ZIRP lasted from 1934 to 1946, a dozen years.  It could be 2021 before short rates rise.  It is really hard for me to imagine a scenario where inflation takes off except for isolated supply shocks in the current environment.

Pushing on a string seems to work for the stock market, if not the economy.

Tuesday, February 28, 2012

How long can rates stay low?

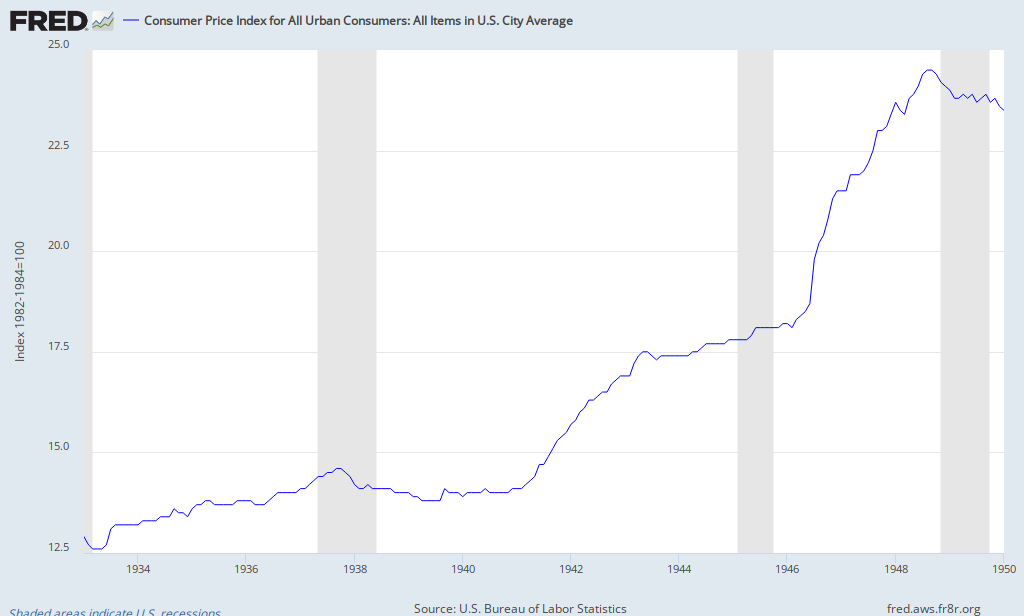
The last time the U.S. was in ZIRP—Zero Interest Rate Policy—was in the Great Depression, and short rates stayed low for a surprisingly long time, from 1934 to 1947, with the much-maligned blip in 1937 being blamed for the recession of 1937-38 by some, while others point to fiscal tightening—together it’s a knock-out punch.  Until 1942 three-month T-bill rates were like today’s, ten or twenty basis points, until 1942 when they were pegged at 38bps for the duration of the war.

FRED Graph

That’s eight years with rates mostly below 20bps, and 14 years if you call 38bps low.  Here’s what was going on with inflation:

FRED Graph

Price controls were used during World War II (and later the Korean War, and later during the early ‘Seventies) to try to control inflation that accelerated after the war until monetary tightening brought on the recession of 1949.

We entered ZIRP at the end of 2008.  It’s only been a little over three years.  It could be a long ride.

Housing bottom? You’ve got to be kidding

With all the divination of the graphical tea leaves going on—are we at a bottom, or bouncing along the bottom, or will we go lower?  gasp!—it is worth remembering that houses are bought “on time,” and that most people buy all the house they can (even if they have to put down 20 percent)—and that interest rates are currently at historical lows, so that a further decline is just about baked in, especially given current price weakness.

If mortgage rates rise from 4 percent to 6 percent, the payment on a 30-year mortgage goes up 25 percent.  People aren’t going to be able to afford the same price house.  Here are empirical results for the Case-Shiller 10 City and US indices showing the inverse relationship between house prices and interest rates very clearly:

image

image

Add to this problem—and interest rates will go up again sometime, and if they go up in a galloping inflation we will see a complete collapse of the housing market, as banks and their regulators will not permit another bubble to form quickly—although one will form even with 20 percent down given enough time—and because interest rates will rise more quickly than house prices, and because people are becoming just as afraid of the housing market as they are of the stock market.

You say we’re near a housing bottom?  You’ve got to be kidding!

Wednesday, May 11, 2011

House prices and interest rates

image

The February value of the index was 153.  The 30-year mortgage rate is about 4.7 percent.  If and when long-term interest rates go up just 150 basis points, housing prices in aggregate might be expected to take a further hit in the neighborhood of one third.

Here is the chart for the Composite-US series beginning in 1987.  A rise in mortgage rates to 6 percent would imply a further 20 percent fall in house prices.  And that assumes no overshooting.

image

As www.patrick.net says, now is not a good time to buy a house. 

***

P.S.  Having just had the opportunity to compare OSX and Windows 7 directly and to get my new computer tweaked to my liking (I deleted all Dell’s bloatware) I must say that Win7 is a pretty good imitation of OSX.  Taskbar = dock, lots of graphical niceties, and with 8 gig RAM and a quad-4 CPU, Win7 does its “ontogeny recapitulates phylogeny” schtick pretty quickly and without too many annoyances.  So convergent evolution appears to have worked okay in this instance.

Thursday, September 9, 2010

Wealth effect vs. wealth illusion

With all the talk about renting vs. buying a house, I thought it might be worthwhile to examine borrowing to own vs. owning outright or paying down principal on a mortgage.

I’ve been trying to convince my brother of the wisdom of paying down his mortgage with the piles of cash he likes to sit on.

Married filing joint the interest deduction doesn’t really kick in until one’s total deductions exceed the standard deduction, which is about $11,000.  Assume a marginal tax rate of 25 percent, which covers a household income of about $68,000 to $137,000.

If the only deductions you have are your mortgage, at a rate of 6 percent you’d have to have a principal outstanding of about $183,000 before you got the first dollar of deductibility (=11,000/.06).  If you make charitable contributions or have other deductions, you will achieve deductibility with a lower principal balance.

Now that 6 percent is paid out of after-tax dollars.  The equivalent before-tax return required to match that as an “investment” would be 6/(1-.25) = 8 percent with certainty.

You can’t get 8 percent with high risk nowadays, let alone with certainty.

So if you own a home and your deductions are below the standard deduction, paying down your mortgage is probably the best financial investment you can make.  It’s also an investment in peace of mind.  After all, your property taxes should be going down, too, so your cost of home ownership should be taking a double dip.

So when my brother tells me he has some huge amount (speaking five figures here) of cash piled up and that he’d feel poor if he paid down some of the balance on his mortgage, a balance still many times his cash balance, I tell him—

“It’s an illusion.  You don’t really have that money.”

With this arithmetic and the mortgage debt of the American people—not to mention the volatility of the stock market the past couple of years—is it any wonder that funds are flowing out of retail mutual funds?

Wednesday, July 29, 2009

The coming squeeze on consumption: we ain’t seen nothin’ yet

Consumption spending has nowhere to go but down.

Untitled-1

Average C/GDP is 64.7 percent.  In 2009Q1 the ratio was 70.5 percent—still over 70.0 percent on the fall in GDP despite about a 2 percent drop in consumption from it peak in third quarter 2007.  Consumer debt service as a percent of disposable personal income is up about 25 percent from 1980, to about 14 percent of disposable income.  One out of every six or seven dollars of the Americans family’s take-home pay goes to interest.  Using the more inclusive Financial Obligations Ratio, one out of every five dollars goes to financial payments.

The federal debt held by the public also increased dramatically from 1980, when the “supply side miracle” failed and the federal government taught Americans how to borrow heavily, with federal debt held by the public rising from 25 percent to now over 50 percent of GDP (data to 2009Q1), forecasted to rise to over 60 percent in coming quarters.

image

Untitled-2

Increases in personal taxes to pay for bank bailouts and social programs will reduce disposable personal income.  Consumption spending hasn’t begun to revert toward mean values supported by income rather than debt, let alone adjusting for increased taxes.

Interest expense at the federal level will increase with the increasing debt, and over time, with increasing interest rates.  The average federal interest expense is 6.0 percent of GDP since 1939.  According to TreasuryDirect, the average interest rate on federal debt is now 3.5 percent.  A 1 percentage point increase across the yield curve would increase interest expense, cet. par., by over 25 percent, or about 1.5 percent of GDP.

Untitled-3

And finally, don’t forget that the saving rate out of disposable income is expected to remain elevated as part of the new frugality, by four or five percentage points.

Adding it all up, a decline in consumption spending on the order of eight or ten percent doesn’t appear unlikely.


Note

From FRED: 

“The Federal Reserve Board has released revised data for the Household Debt Service Ratio from the first quarter 1980 to the present. According to the Federal Reserve Board, recent developments
in credit markets necessitated changing some of the sources used to calculate the ratio.
There are new sources for the distribution of loan types and for student loans, as well as updated
sources for loan maturities and interest rates. The change has shifted the level of the ratio down
but the movement has stayed roughly the same. The new release no longer shows consumer debt and
mortgage debt separately.”  The data is quarterly to 2009Q1.

Tuesday, June 16, 2009

‘Animal spirits’ and the election cycle

Just for kicks I have forecast unemployment to rise to over 12 percent over the next 18 months on the assumption that the NBER will declare an end to the recession to have occurred in about mid-2009 and for unemployment to rise another 18 months after that, somewhat more than after the last recession.  Unemployment then declines at a typical rate through April 2013.

image

“Animal spirits” climb to about zero in time for the next presidential election.  It will probably be a bitterly contested election, perhaps with a third party spoiling the Republicans again.  With soft labor markets and excess capacity in manufacturing, the only inflation threat is a supply shock that will not require the Fed to raise rates. 

Any double-dip recession coming before the next “scheduled” recession in 2014 will be signaled well in advance (as in 1981) by an inversion of the 1/10 Treasury yield curve.  Such an inversion will be caused not by inflation but by failing Treasury bill auctions requiring the Fed to raise short-term rates.  Just as one of the largest tax increases in history followed Ronald Reagan’s massive tax cuts in 1981, when the “supply side miracle” didn’t happen, so Barack Obama and his Congress will probably be obliged to make some of the largest cuts in government spending in history when his stimulus fails to convince our external funders of its success (sse previous post).  There is no “recession” in the NBER sense in sight in the next 12 months or more (see last update).

image

What comes after April 2013, the last month in the forecast period?  That looks to me like the set-up to a short expansion as in the early 1970s, when inflation surged, the Fed tightened, and the economy fell into deep recession. 

The danger of the increasing though still negative "animal spirits” over the next four years is to foster a sense of complacency that precludes real action on the fiscal problems America faces.  The next slump may qualify as a depression by anyone’s definition.

Reference:  Animal spirits in America, April 2009

Tight Spot for Fed, Blind Spot for Investors

Via:  Caijing.com.cn  h/t Zero Hedge.  Pretty well sums up the macro circus of the last four decades.  I liked the fact that he recognizes the role of “animal spirits” in what’s happening now.

Market chatter over green shoots and rising prices has fueled a bear market rally that won't last, despite policymaker 'noise.'

By Andy Xie, guest economist to Caijing and a board member of Rosetta Stone Advisors Ltd.

(Caijing Magazine) A combination of growth optimism and inflation fear has catapulted asset markets in the past few weeks. These two concerns should drive markets in different directions: Inflation fear, for example, should limit room for stimulus and prompt stock markets to retreat. But the investment camps expressing these opposite concerns go separate ways, each pumping up what seems believable. As a result, stock and commodity markets are mirroring the behavior seen during the giddy days of 2007.

Regardless of what investors or speculators say to justify their punting, the real driving force is the return of animal spirit. After living in fear for more than a year, they just couldn't sit around any longer. So they decided to inch back. The resulting market appreciation emboldened more people. All sorts of theories began to surface to justify the market trend. Now that the rising trend has been around for three months globally and seven months in China, even the most timid have been unable to resist. They're jumping in, in droves.

When the least informed and most credulous get into the market, the market is usually peaking. A rising economy and growing income produces more funds to fuel the market. But the global economy is now stuck with years of slow growth. Strong economic growth won't follow the current stock market surge. This is a bear market rally. People who jump in now will lose big.
Over the past three weeks, the dollar dove while oil and treasury yields surged. These price movements exhibited typical symptoms of inflation fear, which is complicating policymaking around the world. The United States, in particular, could be bottled in. The federal government's fiscal stimulus and liquidity pumping by the Federal Reserve are twin instruments for propping up the bursting U.S. economy. The fiscal deficit could top US$ 2 trillion (15 percent of GDP) in 2009. That would increase by one-third the total stock of federal government debt outstanding. Such a massive amount of federal debt paper needs a buoyant Treasury to absorb. If the Treasury market is a bear market, absorption becomes a huge problem.

U.S. Treasury Secretary Timothy Geithner recently visited China to, among other things, persuade China to buy more Treasuries. According to a Brookings Institution estimate, China holds US$ 1.7 trillion in U.S. Treasuries and GSE paper (about 15 percent of the total stock). If China stops buying, it could plunge the Treasury market into deep bear territory. If China does not buy, the Treasury market will get worse. But China can't prop up the market by buying.

In the past few years, purchases by central banks around the world have dominated demand for Treasuries. Central banks have been buying because their currencies are linked to the dollar. Hence, such demand is not price sensitive. The demand level is proportionate to the U.S. current account deficit, which determines the amount of dollars held by foreign central banks. The bigger the U.S. current account deficit, the greater the demand for Treasuries. This is why the Treasury yield was trending down during the bulging U.S. current account deficit period 2001-'08.

This dynamic in the Treasury market was changed by the bursting of the U.S. credit-cum-property bubble. It is decreasing U.S. consumption and the U.S. current account deficit. The 2009 deficit is probably under US$ 400 billion, halved from the peak. That means non-U.S. central banks have much less money to buy, while the supply is surging. It means central banks no longer determine Treasury pricing. American institutions and families are now marginal buyers. This switch in who determines price is shifting Treasury yields significantly higher.

The 10-year Treasury yield historically averages about 6 percent, with about 3.5 percent inflation and a real yield of 2.5 percent. This reflects the preferences of marginal buyers in the United States. Foreign central banks have pushed down the yield requirement substantially over the past seven years. If marginal buyers become American again, as I believe, Treasury yields will surge even higher from current levels. Future inflation will average more than 3.5 percent, I believe. Some policy thinkers in the United States believe the Fed should target inflation between 5 and 6 percent. The Treasury yield could rise to between 7.5 and 8.5 percent from the current 3.5 percent.

A massive supply of Treasuries would only worsen the market. The Federal Reserve has been trying to prop the Treasury market by buying more than US$ 300 billion – a purchase that's backfired. Treasury investors are terrified by the inflation implication of the Fed action. It is equivalent to monetizing national debt. As the federal deficit will remain sky-high for years to come, the monetization could become much larger, which might lead to hyperinflation. This is why the Treasury yield has surged in the past three weeks.

One possible response is to finance the U.S. budget deficit with short-term financing. As the Fed controls short-term interest rates, such a strategy could avoid the pain of high interest rates. But this strategy could crash the dollar.

The dollar index-DXY has fallen 10 percent from the March level, even though the U.S. trade deficit has declined substantially. It reflects the market's expectations that the Fed's monetary policy will lead to inflation and a dollar crash. The cause of dollar weakness is the outflow of U.S. money, in my view. It is the primary cause of a surge in emerging markets and commodities. Most U.S. analysts think the dollar's weakness is due to foreigners buying less of it. This is probably incorrect.

The dollar's weakness can limit Fed policy options. It heightens inflation risks; a weak dollar imports inflation and, more importantly, increases inflation expectations, which can be self-fulfilling in today's environment. The Fed has released and committed US$ 12 trillion (83 percent of GDP) for bailing out the financial system. This massive overhang in money supply could cause hyperinflation if not withdrawn in time. So far, the market is still giving the Fed the benefit of the doubt, believing it will indeed withdraw the money. Dollar weakness reflects the market's wavering confidence in the Fed. If the wavering continues, it could lead to a dollar collapse and make inflation self-fulfilling.

The Fed may have to change its stance, even using token gestures, to assure the market it won't release too much money. For example, signaling rate hikes would soothe the market. But the economy is still in terrible shape; unemployment may surpass 10 percent this year. Any suggestion of hiking interest rates would dampen growth expectations. The Fed is caught between a rock and a hard place.

Oil prices have doubled since a March low, even though global demand continues to decline. The driving forces again are expectations of inflation and a weaker dollar. As U.S.-based funds flee, some of the money has flowed into oil ETFs. This initially impacted futures prices, creating a huge gap between cash and futures prices. The gap increased inventory demand as investors tried to profit from the gap. Rising inventory demand caused spot prices to reach parity with futures prices. Rising oil prices, though, lead to inflation and depress growth. It is a stagflation factor. If the Fed doesn't rein in weak dollar expectations, stagflation will arrive sooner than I previously expected.

Stagflation in the 1970s spawned the development of rational expectation theory in economics. Monetary stimulus works by fooling people into believing in money's value while the central bank cheapens it. This perception gap stimulates the economy by fooling people into demanding more money than they should. Rational expectation theory clarified the underpinning for Keynesian liquidity theory. However, as they say, people can't be fooled three times. Central banks that tried to use stimuli to solve structural problems in the '70s saw their stimuli didn't work. People saw through what they tried again and again, and began behaving accordingly, which translated monetary stimulus straight into inflation without stimulating economic growth.

Rational expectation theory discredited Keynesian theory and laid the foundation for Paul Volker's tough love policy, which jagged up interest rates and triggered a recession. The recession convinced people that the central bank was serious about cooling inflation, so they adjusted their behavior accordingly. Inflation expectations fell sharply afterward. The credibility that Volker brought to the Fed was exploited by Alan Greenspan, who kept pumping money to solve economic problems. As I have argued before, special factors made Greenspan's approach effective at the same. Its byproduct was asset bubbles. As the environment has changed, rational expectation theory will again exert force on the impact of monetary policy.

Movements in Treasury yields, oil and the dollar underscore the return of rational expectation. Policymakers have to take actions to dent the speed of its returning. Otherwise, the stimulus will lose traction everywhere, and the global economy will slump. I expect at least gestures from U.S. policymakers to assuage market concerns about rampant fiscal and monetary expansion. The noise would be to emphasize the "temporary" nature of the stimulus. The market will probably be fooled again. It will fully wake up only in 2010. The United States has no way out but to print money. As a rational country, it will do what it has to, regardless of its rhetoric. This is why I expect a second dip for the global economy in 2010.

While inflation expectations are causing some in the investor community to act, the rest are betting on strong economic recovery. Massive amounts of money have flowed into emerging markets, making it look like a runaway train. Many bystanders can't take it any longer and are jumping in. Markets, after trending up for three months, are gapping up. Unfortunately for the last-minute bulls, current market movements suggest peaking. If you buy now, you have a 90 percent chance of losing money when you try to get out.

Contrary to all the market noise, there are no signs of a significant economic recovery. So-called green shoots in the global economy are mostly due to inventory cycles. Stimuli might juice up growth a bit in the second half 2009. Nothing, however, suggests a lasting recovery. Markets are trading on imagination.

The return of funds flowing into property is even more ridiculous.  A property burst usually lasts for more than three years. The current burst is larger than usual. The property market is likely to remain in bear territory for much longer. The bulls are talking about inflation as the bullish factor for property. Unfortunately, property prices have risen already and need to come down even as CPI rises. Then the two can reach parity.

While rational expectation is returning to part of the investment community, most investors are still trapped by institutional weakness, which makes them behave irrationally. The Greenspan era has nurtured a vast financial sector. All the people in this business need something to do. Since they invest other people's money, they are biased toward bullish sentiment. Otherwise, if they say it's all bad, their investors will take back the money, and they will lose their jobs. Governments know that, and create noise to give them excuses to be bullish.

This institutional weakness has been a catastrophe for people who trust investment professionals. In the past two decades, equity investors have done worse than those who held U.S. market bonds, and who lost big in Japan and emerging markets in general. It is astonishing that a value-destroying industry has lasted so long. The greater irony is that salaries in this industry have been two to three times above what's paid in other sector. The key to its survival is volatility. As markets collapse and surge, possibilities for getting rich quickly are created. Unfortunately, most people don't get out when markets are high, as they are now. They only take a ride.

Indeed, most people who invest in the stock market get poorer. Look at Japan, Korea and Taiwan: Even though their per capita incomes have risen enormously over the past three decades, investors in these stock markets lost money. Economic growth is a necessary but not sufficient condition for investors to make money in the stock market. Most countries, unfortunately, don't possess the conditions for stock markets to reflect economic growth. The key is good corporate governance. It requires rule of law and good morality. Neither is apparent in most markets.

It's a widely accepted notion that long term stock investors make money. Actually, this is not true. Most companies don't last for more than 20 years. How can long term investment make money for you? The bankruptcy of General Motors should remind people that this notion is ridiculous. General Motors was a symbol of the U.S. economy, a century-old company that succumbed to bankruptcy. In the long run, all companies go bankrupt.

Property on the surface is better than the stock market. It is something physical that investors can touch. However, it doesn't hold much value in the long run either. Look at Japan: Its property prices are lower than they were three decades ago. U.S. property prices will likely bottom below levels of 20 years ago, after adjusting for inflation.

China's property market holds even less value in the long run. Chinese properties are sitting on land leased for 70 years for residential properties and 50 years for commercial properties. Their residual values are zero at the end. The hope for perpetual appreciation is a joke. If you accept zero value at the end of 70 years, the property value should only be the use value during those 70 years. The use value is fully reflected in rental yield. The current rental yield is half the mortgage interest rate. How could properties not be overvalued? The bulls want buyers to ignore rental yield and focus on appreciation. But appreciation in the long run isn't possible. Depreciation is, as the end value is zero.

The world is setting up for a big crash, again. Since the last bubble burst, governments around the world have not been focusing on reforms. They are trying to pump a new bubble to solve existing problems. Before inflation appears, this strategy works. As inflation expectation rises, its effectiveness is threatened. When inflation appears in 2010, another crash will come.
If you are a speculator and confident you can get out before it crashes, this is your market. If you think this market is for real, you are making a mistake and should get out as soon as possible. If you lost money during your last three market entries, stay away from this one – as far as you can.

Saturday, June 6, 2009

Which way out for the Fed?

Via:  The Economist

Central banks' exit strategies
This way out

Jun 4th 2009 | WASHINGTON, DC
From The Economist print edition

The Federal Reserve weighs plans to unwind its unconventional stimulus

A FIREFIGHTER’S first rule of survival is “know your way out”. The same can be said of financial firefighting. Though it has no intention of exiting soon, the Federal Reserve is planning its path out from the extraordinary measures it has taken to free credit markets and boost demand.

With other central banks, the Fed is under growing pressure to explain its exit strategy in order to allay fears that its policies will produce inflation. On June 2nd Angela Merkel, the German chancellor, launched an astonishing attack on the Fed, the Bank of England and the European Central Bank (ECB) for their loose monetary policies. Mrs Merkel’s outburst, which trampled on a German political tradition of not commenting on the actions of independent central banks, makes life awkward for the ECB, which was due on June 4th to announce details of a plan to buy €60 billion ($86 billion) of covered bonds. But her most pointed barbs were aimed elsewhere. “I am very sceptical about the extent of the Fed’s actions and the way the Bank of England has carved its own little line in Europe,” she said.

The Fed did most to unsettle Mrs Merkel and its other critics when it said on March 18th that it would buy $300 billion in Treasuries by September, plus $200 billion in bonds issued by Fannie Mae and Freddie Mac, America’s two housing-finance giants, as well as $1.25 trillion of their mortgage-backed securities by December. The purchases are meant to drive down long-term interest rates, and at first they did. Ten-year Treasury yields fell to 2.5% from 3%. But by June 3rd they were back up to 3.5%.

Some of this increase is indeed down to higher inflationary expectations. Inflation-protected bonds now imply future inflation of 2%, up from close to zero late last year, according to Barclays. On June 3rd Ben Bernanke, the Fed chairman, put some of the increase in yields down to concern about surging government borrowing.

But the Fed attributes most of the increase in yields to investors abandoning the safety of Treasuries for riskier investments as economic optimism rises. By itself, that is not a reason for the Fed to step up bond purchases, an option it has kept open. “The aim of the programme was mostly to bring down mortgage rates and generate another wave of refinancing, which it did,” says William Dudley, president of the Federal Reserve Bank of New York*. “That said, if the choice were to keep mortgage rates lower for longer or have a recovery, I’d pick the latter.” But there may be a case for the Fed to schedule extra, smaller purchases to avoid a sharp rise in yields when the current programme ends.

The Fed has financed its loans and securities purchases in the past year by creating new reserves for the banking system (in effect, printing money). Reserves have rocketed, to almost $900 billion now from an average of $11 billion in the year to September. Many analysts see these excess reserves as a pool of inflationary fuel just waiting for the match of credit demand.

The Fed considers this analysis flawed. It sees excess reserves as a problem only if they overwhelm its ability to raise the federal funds rate when need arises. That risk has shrunk since the Fed received authority in September to pay interest on reserves, as other major central banks have long been able to. That in theory should put a floor under the Fed funds rate. Banks should not lend excess reserves at, say, 1%, if they can earn 2% from the Fed.

That said, the Fed cannot be certain that paying interest will work as planned, so it would also like to be able to soak up some reserves. Some were created by the Fed’s myriad loans to banks, issuers of commercial paper and others to unfreeze the credit markets. Those liquidity facilities charge borrowers a penalty rate which makes them less attractive as private credit returns. That is now happening, and the liquidity facilities have begun to shrink (see chart). The Fed could hurry that process up by raising the penalties.

Managing its growing securities holdings will be tougher. The Fed could simply sell them but that would create waves. “The day you sell will be a big market event,” says Mr Dudley. “Historically, the Fed has been buy and hold.” Since the average maturity of the Fed’s bond holdings is five to ten years, the Fed will have to find a way to mop up, or “sterilise”, the related bank reserves for a long time. The usual approach is to conduct reverse-repurchase agreements, borrowing from one of its 16 primary dealers for short periods of time in order to finance the assets on its balance-sheet. But dealers may not have the necessary capacity for the task.

The Fed is currently absorbing reserves by having the Treasury issue more debt than it needs. When dealers purchase the debt, cash shifts from their reserves accounts to Treasury deposits at the Fed, where they remain, unspent. But the Treasury itself is constrained by the debt ceiling set by Congress, and an independent central bank should not rely on the fiscal authority for one of its tools.

A better solution would be for the Fed to issue its own bills, as other central banks do. It could rely on a wider variety of investors, not just primary dealers, to manage its balance-sheet. It would restrict the maturity of such bills to less than 30 days to avoid interfering with Treasury’s longer-dated issuance. The hitch is that Congress has to authorise it. It may come to that. “As long as people are worried about whether we have adequate tools, it makes sense for us to get more tools even if we don’t think we need them,” says Mr Dudley.

Will paying interest on reserves prevent a new carry trade if an asset inflation heats up?  I doubt it.

Thursday, May 28, 2009

Slope of yield curve and growth

With all the hoopla about rising Treasury yields, it is worth remembering that the slope of the yield curve has been a pretty good predictor of future real growth.  Click on graph for larger image.

image

Growth might accelerate into 2011 and then level off or decline.  If “inflation” of the traditional wage-price variety accelerates, while not likely given the state of the labor market, that would pose a danger in that the Fed would presumably have to tighten to control it.  (The Fed doesn’t tighten to control asset inflations.)  The current steepening of the yield curve is entirely consistent with our last “animal spirits” update forecast of “no recession [in the NBER sense] in sight”; the next update comes in June after the May unemployment release.  Real growth will accelerate to maybe 2 percent.

The higher yields at the long end and increasing risk aversion among foreign debt buyers (but not the Fed!) should push Treasury sales further into the short end, so short run, Treasury wins, perhaps.  But if there are indications of accelerating inflation at all, a classical rush to the short end and inversion of the yield curve might presage Obama becoming a one-term president.  Hence, it is in the Democrats’ interest, regardless of their rhetoric, to keep the labor market down.  The President’s continuing appeasement of the ruling class would seem to guarantee this; he hasn’t breathed a word about doing away with George Bush’s tax cuts for the rich in ages (see this for my take on the big picture, if you haven’t already).  So much for shared sacrifice.

At some point either the labor market will kick back and inflation happen, or the economy will implode again as bad debts transferred onto the taxpayers’ tab cause demand to fail—the dollar will collapse—and foreign investors will demand even higher rates.  If the current social contract remains in place, this will be the coup de grace for the American middle class—there won’t be one anymore.  There will be a rich elite (the top ten percent of Americans now take half of all national income) and a captive working class, still better off than the poor in the less developed countries, but without access to the educational opportunities and social connections required to jump to the upper class except in rare instances.  The rich will grumble about paying the lion’s share of taxes, as they do now, while taking a pig’s share of all income.

Hence, we stick to our adherence to the Strauss and Howe hypothesis of a renegotiation of the American social contract culminating in a massive crisis over the next dozen years or so (see this and this).