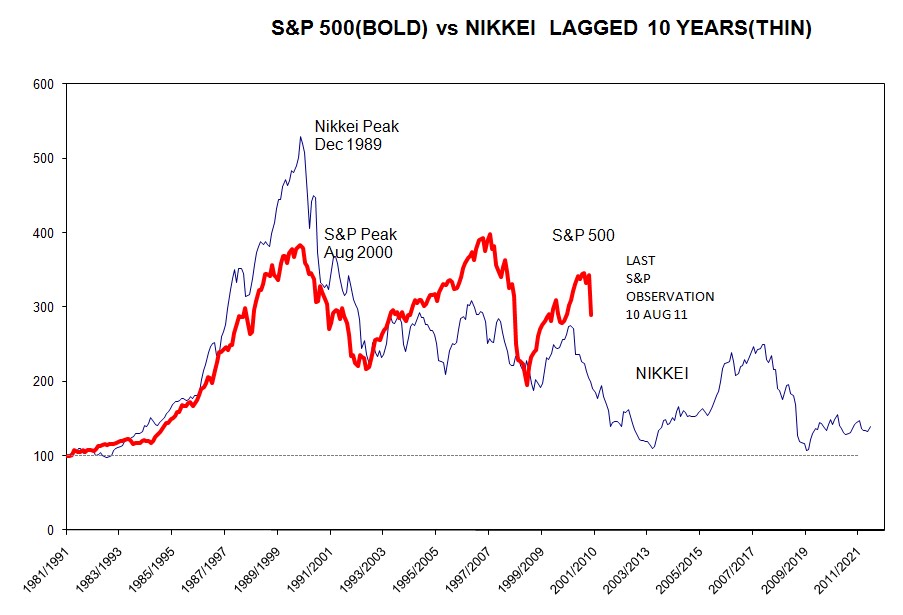
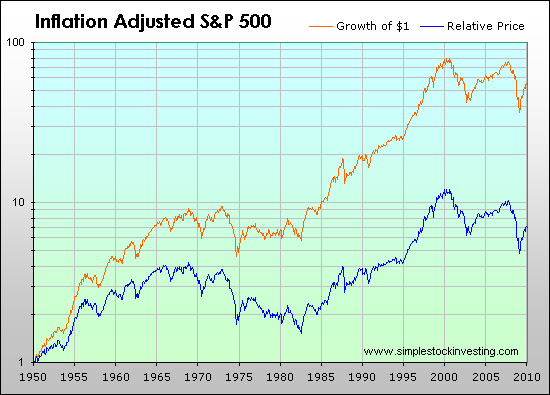
Here is a graph of the S&P 500 deflated by the CPI. Which way do you think it is going?
Here is a graph of the S&P 500 deflated by the CPI. Which way do you think it is going?
Didier Sornette has some great stuff out now. See his Ted talk and this white paper, “The Illusion of the Perpetual Money Machine,” in which he he pretty well demolishes the con game that the economics profession—slave to Wall Street—has been playing at the great expense of the people of the world. I’ve written previously about the faster than exponential growth theory of singularities, financial and otherwise (see here).
The bad debt will be cleared. Sornette indicates that his models show that the anticipated phase transition out of the growth era, originally forecast for 2030-2060 in his work with Johansen, has begun.
Andrew Jackson’s last words before dying were, “I killed the Bank!”
Where is our Andrew Jackson?
N.B. The following is research, not investment advice. You invest at your own risk, unlike the Wall Street banks, who also invest at your risk.
The Coppock curve is tracking downward.
The Coppock curve sends a long-term bottom signal when it turns up from a negative reading. Assuming the curve does not bounce up again—anything is possible but it has only bounced from this low before once, in 2012—how long until the next major market bottom? The mean number of months from a similar Coppock value ~67 to the next bottom (the signal in 2001 was the only false positive and is ignored, taking the second signal in 2002 as the true signal) was 11.6 months, with a max of 19 and a min of 5.
So the average expectation would be for a bottom in the summer of 2014, a very crude second degree polynomial fit to the the series of signal leads gives a lead time of ~8 months for a bottom in spring 2014, which has a certain harmonic resonance with the Seventies big bottom which was in March 1974.
By the way, long interest rates rose all the way up to the bottom in 1974—and beyond, of course. However, if the world economy hits an air pocket (failure of effective demand) we could see stock prices falling and further disinflation or deflation. Remember, the last ZIRP lasted from 1934 to 1946, a dozen years. It could be 2021 before short rates rise. It is really hard for me to imagine a scenario where inflation takes off except for isolated supply shocks in the current environment.
Pushing on a string seems to work for the stock market, if not the economy.
Via: www.pitchford.com Spotify and Pandora exist not to help musicians but only to make their founders rich by fleecing greedy venture capitalists and speculative investors. Money quotes:
Damon Krukowski of Galaxie 500 and Damon & Naomi breaks down the meager royalties currently being paid out to bands by streaming services and explains what the music business' headlong quest for capital means for artists today.
"Galaxie 500's 'Tugboat' was played 7,800 times on Pandora in the first quarter of 2012, for which its three songwriters were paid a collective total of 21 cents, or seven cents each."
"When I started making records, the model of economic exchange was simple; now, it seems closer to financial speculation."
But here's the rub: Pandora and Spotify are not earning any income from their services, either. In the first quarter of 2012, Pandora-- the same company that paid Galaxie 500 a total of $1.21 for their use of "Tugboat"-- reported a net loss of more than $20 million dollars. As for Spotify, their latest annual report revealed a loss in 2011 of $56 million.
Leaving aside why these companies are bothering to chisel hundredths of a cent from already ridiculously low "royalties," or paying lobbyists to work a bill through Congress that would lower those rates even further-- let's instead ask a question they themselves might consider relevant: Why are they in business at all?
"Pandora and Spotify are doing nothing for the business of music-- except undermining the simple cottage industry of pressing ideas onto vinyl, and selling them for more than they cost to manufacture."
The answer is capital, which is what Pandora and Spotify have and what they generate. These aren't record companies-- they don't make records, or anything else; apparently not even income. They exist to attract speculative capital. And for those who have a claim to ownership of that capital, they are earning millions-- in 2012, Pandora's executives sold $63 million of personal stock in the company. Or as Spotify's CEO Daniel Ek has put it, "The question of when we'll be profitable actually feels irrelevant. Our focus is all on growth. That is priority one, two, three, four and five."
The most famous of long-term momentum oscillators has just made one of its biggest bounces in history! While the Coppock guide is a bottom indicator, almost always signaling long-term upward momentum when it turns up from a negative reading, it has only had bounces like this one a few times before, and they have always preceded big bear markets.
Remember: This is research, not investment advice. You invest at your own risk, unlike the Wall Street banks, who also invest at your risk (if you are a US taxpayer).
Via: San Francisco Fed h/t www.macrofugue.com
To examine the historical relationship between demographic trends and stock prices, we consider a statistical model in which the equity price/earnings (P/E) ratio depends on a measure of age distribution (for another example, see Geanakoplos et al. 2004). We construct the P/E ratio based on the year-end level of the Standard & Poor’s 500 Index adjusted for inflation and average inflation-adjusted earnings over the past 12 months. We measure age distribution using the ratio of the middle-age cohort, age 40–49, to the old-age cohort, age 60–69. We call this the M/O ratio.
Okay, in addition the current younger generation is saddled with record levels of student loan debt, the economy isn’t generating many good paying jobs, and we’re in a post credit crisis sucky cyclical recovery.
By these lights the bear market could go another ten years.
Nothing on this web site should be construed as investment advice. This is pure research and speculation. You trade at your own risk, unlike the Wall Street banks, who also trade at your risk.
Confidence stalls when things stop getting better than what we’re used to. Confidence fails when they become worse than what we’re used to. Defined solely in terms of the unemployment rate, confidence now has a one percentage point cushion between current rate (7.8 percent) and adaptation level (~8.8 percent). If the unemployment rate stabilizes and climbs a percentage point because the economy falls off some form of fiscal cliff, the actual rate will hit the adaptation level, which historically has almost always precipitated a failure of confidence and a negative jag in output and employment. The forecast is below. The remainder of the decade is likely to resemble the ‘Seventies (the 30 year inflation cycle was staggered a year by mini-depression and QE) as cost-push inflation rears its ugly head (see South Africa today) and reserves liquidity feeds into a wage price spiral.
If the American stock market follows the ‘Seventies pattern, there will be a steep bear market bottoming in about first half 2014, and then a “bull market” in which total return to shares is something less than the rate of inflation.
Via: investopedia.com
Unlike most studies, which are based on total returns, Santa-Clara and Valkanov based their efforts on the average excess return of the indexes over the return of the three-month Treasury bill. The results were striking. When a Republican president held office, the value-weighted return delivered nearly a 2% premium over the T-bill. When a Democrat held office, the premium was nearly 11%. While the 9% difference clearly favors the Democrats, the results from the equal-weighted portfolio were even more telling, with a 16%+ result in favor of the Democrats. (To learn more about T-bills and other government securities, read 20 Investments You Should Know: Treasuries.)
Republican Administrations
Democratic Administrations Value Weighted 1.69% 10.69% Equal Weighted
-0.01% 16.52% Figure 1: Excess returns of CRSP indexes versus three-month Treasury bill, 1927-1998
Further investigation reveals the results were generated by higher real returns and lower interest rates under Democratic administrations. Business cycle fluctuations showed no correlation to the results, demonstrating statistically significant outperformance for the Democrats regardless of underlying economic conditions. Value-weighted portfolios posted a steady 10% premium in favor of the Democrats, while equal-weighted portfolios came in at around 20%. (Read more about recognizing business cycles in Understanding Cycles – The Key To Market Timing.)
Read more: http://www.investopedia.com/articles/financial-theory/08/political-party-democrat-republican-stock-returns.asp#ixzz24T70uam3rVia: washingtonpost.com
If America lurches right, whether out of disappointment with the Obama economy or with Obama himself, there will be weeping and gnashing of teeth among the 99 percent, and social stresses will be pushed even further. If the response is totalitarian, America will become the land of the most definitely un-free. And the blowback will intensify. These social dynamics are pretty well understood.
If the ruling class would adopt the position that, “From those to whom much has been given, much shall be expected,” an incrementalist solution might be possible. But as Strauss and Howe maintain, the Crisis turning is all about revolution (one hopes a non-violent one), not about incremental progress. This is Obama’s great failing: that he was presented with an historical moment that would have welcomed revolutionary change, and he elected (or perhaps was constrained to) support the status quo in every regard but trying to get a Republican-inspired health plan passed.
Plus les choses restent les mêmes, plus ils vont changer, to coin a phrase.
Friday, May 18, 2012
Coppock curve update
WARNING: WHAT FOLLOWS IS RESEARCH, NOT INVESTMENT ADVICE. YOU INVEST AT YOUR OWN RISK, UNLIKE THE WALL STREET BANKS, WHO ALSO INVEST AT YOUR RISK.
I have previously shown how the current situation resembles that of 1972-1973: depressed Michigan sentiment, my animal spirits metric climbing above zero. If we follow the early ‘Seventies pattern, we are on the cusp of a severe recession (actually, I believe we will have to start calling it a depression in polite society if even the mal-measured unemployment rate climbs above ten percent and lingers there).
So it was of some interest to me to update my implementation of the venerable Coppock curve, a long-term stock market momentum indicator that gives a reliable buy signal when it turns up from a negative reading (the one false positive having been in the early ‘Oh-Ohs). In this light the stock market also resembles the early ‘Seventies situation, even to exhibiting a very well formed “killer wave,” a descent from a top with a hitch on the way down, very much as it did in the early ‘Seventies, and before that, coming off the major late ‘Sixties top. Here are the charts.
Scaled the same way, side by side (note the higher highs and the lower lows in the recent period):
Saturday, December 10, 2011
Secular exhilaration! take 2
So what happened to the stock market in the early ‘Seventies episode, you might ask.
The market peaked right at the New Year of 1973. By analogy we might expect the same for 2012. From the previous post note the leading nature of the Michigan Sentiment series, which recently had its own pop to the upside. Expect some delusional holiday cheer out of Old Europe to keep the fake rally going, but after New Year’s Eve and the first few trading days of 2012, it might be time to say “risk off.”
N.B. This is research, not investment advice. You invest at your own risk, unlike the Wall Street banks, who also invest at your risk. Just wait until the Euro sovereign CDSs come home to roost, how the Wall Street bankers come to Uncle Bernie with their hands out (Uncle Sam doesn’t have the cojones to give them any more money, afraid of being tarred and feathered).
Tuesday, November 22, 2011
Bernanke serves his Wall Street masters
The Top 0.1% Of The Nation Earn Half Of All Capital Gains – Forbes
Capital gains are the key ingredient of income disparity in the US-- and the force behind the winner takes all mantra of our economic system. If you want even out earning power in the U.S, you have to raise the 15% capital gains tax.
Income and wealth disparities become even more absurd if we look at the top 0.1% of the nation's earners-- rather than the more common 1%. The top 0.1%-- about 315,000 individuals out of 315 million-- are making about half of all capital gains on the sale of shares or property after 1 year; and these capital gains make up 60% of the income made by the Forbes 400.
It's crystal clear that the Bush tax reduction on capital gains and dividend income in 2003 was the cutting edge policy that has created the immense increase in net worth of corporate executives, Wall St. professionals and other entrepreneurs.
Bernanke Speech Moves Markets: No New Stimulus – ABC News
The effectiveness of first two QEs has been questioned. Critics acknowledge that easing has brought temporary benefits, but they argue those have accrued primarily to the stock market. They question whether flooding the markets with yet more cheap money is a good thing for the economy long-term.
Just so that it’s perfectly clear what’s going on. The country’s markets are being looted by the central bank to benefit of the ruling class. I personally, while supposedly a “sophisticated investor,” am terrified of our totally rigged and corrupt stock market.
Have a good day.
Thursday, August 11, 2011
This is not investment advice
The first chart is from www.angrybear.com, the second from www.stockcharts.com.
This is research, not investment advice. You trade at your own risk, unlike the Wall Street banks, who also trade at your risk.
The S&P 500 is about to make a “death cross” when the 50 day moving average crosses below the 200 day moving average. Downward momentum could easily build.
Wednesday, June 15, 2011
Long-term stock market valuation
This is research, not investment advice. You trade at your own risk.
Source: Robert Shiller’s home page
Note also the current ratio of corporate profits to GDP:
And this:
Shrinking profits (forecast) imply shrinking market capitalization. Corporations would have to buy back an inordinate amount of stock to maintain prices, methinks.
Tuesday, December 7, 2010
Boomer bust
www.Contraryinvestor.com has a nice write-up of the demographic nightmare facing the stock market. As www.zerohedge.com has been reporting for a while, the insider sell-to-buy ratio has been exploding recently, as insiders read Rosie. So to counter the funny-money Santa Claus rally that’s popping on the Street today, take a read of what the Age Wave suggests for the future. When contemplating the miserable yields available under ZIRP (though surfing the yield curve can be fun in a tax-deferred way), remember that some coke head somewhere once wrote a book titled “Less Than Zero,” which probably summed up his knowledge of mathematics, but also sums up what might be expected from equity returns over the next decade…. My question: will the Big Bottom, when it finally arrives, be a buying opportunity? It has to be, doesn’t it, by the iron laws of behavioral overshooting…?
Just Where Is The Equity In All Of This? – contraryinvestor.com
Wednesday, December 1, 2010
Sunspots and stock market returns
Data monthly on sunspots is available from NASA here. The history of the Dow Jones Industrial average can be downloaded from finance.yahoo.com. The chart below shows the sunspot cycle and and rolling 66 month price-only returns to the Dow, representing half of the approximately 11 year length of the solar cycle. The trend lines are both over 132 months, the length of the solar cycle.

It is evident that there is some correlation with the solar cycle appearing to lead (I’m sorry, I’m just having fun). The biggest 5.5 year blow off was in 1987, with the secondary blow off occurring in 2000. Sunspot activity has been very low recently, although the next cycle is poised to peak in 2012 or 2013. This site provides some interesting historical correlations. Charles Nenner believes the cycle, along with other factors, forecasts a major war beginning in about 2013 (link), and a Dow going to 5000 in the next several years.
What is supportive of the hypothesis of a major slowdown of human activity in general (“the change”) in the future, however, is the NASA forecast for the next solar cycle, which is very, very low.

Source: NASA
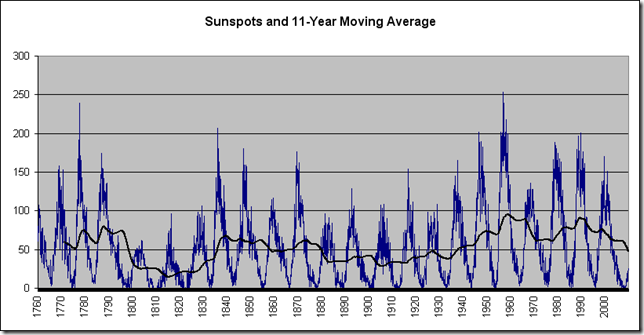
The climate of the early nineteenth century was notably cool (source), with the winter of 1810 being described as “arctic.” The winters of 2032 and succeeding ones might be similar if it takes a low cycle to really cool off. Or, at least, global warming might be mitigated.
Friday, August 6, 2010
High frequency bloodsuckers
If you haven’t seen pictures of what’s really going on in the markets, take a look at these posts that detail what high frequency trading looks like. Unbelievable.
Crop Circle of the Day - Quote Stuffing and Strange Sequences - Nanex
Market Data Firm Spots the Tracks of Bizarre Robot Traders – The Atlantic
Cisco’s Sub Second Melt Up and Identifying Crop Circles in the High Frequency Market Data – www.cryptogon.com
Wednesday, May 19, 2010
A stark warning on the stock market
Via: Business Insider Warning: this is research, not investment advice. You invest at your own risk.
Dow Theorist Richard Russell: Sell Everything, You Won't Recognize America By The End Of The Year
Joe Weisenthal | May. 18, 2010, 8:57 AM
WHOA!
Richard Russell, the famous writer of the Dow Theory Letters, has a chilling line in today's note:
Do your friends a favor. Tell them to "batten down the hatches" because there's a HARD RAIN coming. Tell them to get out of debt and sell anything they can sell (and don't need) in order to get liquid. Tell them that Richard Russell says that by the end of this year they won't recognize the country. They'll retort, "How the dickens does Russell know -- who told him?" Tell them the stock market told him.
That's pretty intense!
Update: By popular demand, here's more on what he sees in the market. The gist is that the markets recent gyrations are telling him that the economy is in trouble:
And I ask myself, "Am I seeing things? The April 26 high for the Dow
was 11205.03. The Dow is selling as write at 10557 down 648 points
from its April high. If business is even better than expected, then
why is the Dow down over 600 points? And why, if there were 674 new
highs on the NYSE on April 26, were there only 20 new highs on Friday,
May 14? And if my PTI was 6133 on April 26, why is it down 17 points
since its April high?The fact is that I've been seeing deterioration in the stock market
ever since early-April, and this in the face of improving business
news. The D-J Industrial Average is composed of 30 internationally
known top-quality blue-chip stocks. These are 30 of "America's biggest
companies." If Barron's is so bullish on the future of America's
biggest companies, then why isn't the Dow advancing to new highs?
Clearly something is wrong. But what could it be? Much as I love
Barron's, I trust the stock market more. If I read the stock market
correctly, it's telling me that there is a surprise ahead. And that
surprise will be a reversal to the downside for the economy, plus a
collection of other troubles ahead.About Dow Theory -- First, we saw the recent April highs in the
Averages. Then we saw a plunge in both Averages to their May 7 lows --
Industrials to 10380.43, Transports to 4298.12, next a short rally. If
ahead, the two Averages turn down and violate their May 7 lows, that
would be the clincher. Such action would signal the certain resumption
of the primary bear market.Just as for years I asked, cajoled, insisted, threatened, demanded,
that my subscribers buy gold, I am now insisting, demanding, begging
my subscribers to get OUT of stocks (including C and BYD, but not
including golds) and get into cash or gold (bullion if possible). If
the two Averages violate their May 7 lows, I see a major crash as the
outcome. Pul - leeze, get out of stocks now, and I don't give a damn
whether you have paper losses or paper profits!Friday, May 7, 2010
‘Animal spirits’ update
The primary insight driving the business cycle forecasts on this web site is that recessions and depressions are primarily psychologically driven collapses of demand caused by conditions in the labor market as measured by the unemployment rate becoming worse than what people are accustomed to over the past four years.
The increase in the unemployment rate caused mild downtick in the confidence of Americans, but “animal spirits” are still chugging upward toward the next cyclical high in about 2012-2013. There is no recession in sight, although demand is fundamentally unbalanced by the extreme inequality in incomes and wealth, and will probably enter a sustained collapse in the next downturn due to debt deflation.

“Animal spirits” is given by A = – (U-UMEAN)/Sigma(U). U is still above adaptation level, signifying that “animal spirits” are depressed. Given my freehand forecast of unemployment, “animal spirits” should become marginally positive at just about the time of the next presidential election. Although it is too far out to forecast with a high degree of confidence, the next recession should arrive in 2013-2014. I expect this collapse to be a full-fledged depression. This will begin the final stage of Strauss and Howe’s generational crisis; it will begin the long-wave winter’s coldest days.
Unemployment volatility will probably peak soon, and this will contribute to the rising good feelings over the next couple of years. The stability will be short-lived, and garnered at the government’s expense. It is well known that the government recently has been spending more on extended unemployment benefits than it has on federal salaries. In the final crisis the government’s access to funds will dry up. The markets will refuse to lend, and the rich will tell their Congress people they won’t pay any more taxes (although marginal tax rates are lower now than at when Ronald Reagan reigned). Greed has triumphed and continue to do so. The rich would rather let the system collapse, and try to take their money elsewhere, than prop up the government once it no longer serves their purposes. IMHO.

The recession forecasting model featured on this web site has accurately made real-time calls of the past two cycles (2001 and 2007-2009, both the collapses and the recoveries). There are many similar models using the yield curve; the innovation here is “animal spirits.” The model shows no recession in sight over the next year.

The stock market continues to look like a very dangerous place to be.

The Coppock momentum oscillator, a bottom indicator, having sent a great buy signal in early 2009, is at elated levels, suggesting the market rally has some continuing momentum. But the big picture looks like the market is approaching the crest of a B wave on its way down to a C big bottom. Gold has been killing the stock for ten years and may continue to do so.
Monday, March 22, 2010
A blow-off move coming in technology?
The next major resistance for the NDX is the 2007 high. It has blown through the 61.8% retracement level. Following the trend line it would take about another three months to reach the old high. The high might come about the time of the summer solstice. The secular bear market would continue after that. The S&P 500 is approaching 61.8% retracement levels, and seems about done.
Subscribe to: Posts (Atom)