Showing posts with label employment. Show all posts

Tuesday, September 24, 2013

Was full employment a debt-illusion?

http://research.stlouisfed.org/fred2/graph/?s%5B1%5D%5Bid%5D=EMRATIO

The Great Debt Illusion began with "Supply Side Economics" in Reagan I, a con game that provided definitive proof that tax cuts for the rich do not provide growth that "trickles down" to everyone else. Here's the picture of federal debt:

http://research.stlouisfed.org/fred2/series/GFDEGDQ188S

Notice where the take-off occurs. Add to this insight that it was a Republican, Nixon, who took us off the gold standard in 1971, setting the stage for massive monetization of federal debt, and it is hard not to conclude that the modern-era Republicans are the most fiscally-irresponsible party in American history. All their talk of austerity is in fact mere mean-spiritedness. This is the distinguishing characteristic of the Republican Party today.

Today, the House Republicans take pride in being the most hard-hearted folks in the country, proving it by taking their greedy frustration out on women and children by cutting funding for food stamps.

This is a party without a future.

On the employment issue: in the Sixties, it was possible to support a family on one (male) income. Not so today except for the top few percent. Multi-generational living is a growing trend, and maybe not such a bad one if it brings families closer together.

Shalom.

Monday, June 11, 2012

The politics of envy and austerity

Via:  America’s Hidden Austerity Program – nytimes.com

[T]here is something historically different about this recession and its aftermath: in the past, local government employment has been almost recession-proof. This time it’s not. Going back as long as the data have been collected (1955), with the one exception of the 1981 recession, local government employment continued to grow almost every month regardless of what the economy threw at it. But since the latest recession began, local government employment has fallen by 3 percent, and is still falling. In the equivalent period following the 1990 and 2001 recessions, local government employment grew 7.7 and 5.2 percent. Even following the 1981 recession, by this stage local government employment was up by 1.4 percent.

Source: Bureau of Labor Statistics

Who is losing these local government jobs? In 1981 it was mostly teachers. Now, the losses are shared by teachers and other local government workers alike.

The recall election in Wisconsin was all about people seeing state and local government employees with good incomes and, more importantly, guaranteed defined benefit pensions, something which has eluded a majority of the graying baby boom generation (your correspondent included—I’ve always come on board just after the existing employees have been grandfathered into a DB pension; and I’ve gotten a cash balance plan instead worth literally peanuts.)

Now, given our less than stellar educational attainment as a nation, you might think that abusing the teachers is a bad idea.  And it is.  Most intelligent people will not even consider becoming a teacher anymore, having heard from friends and acquaintances the horror stories of classroom misconduct and lack of support from and abuse by administrators.  The burn-out rate among teachers is high. 

So, yes, perhaps government unions got ahead of where they should have been in pay, pension and benefits, and the envy of others was understandable.

But a society that abuses its teachers—and there was a very strong element of this present in the debate in Wisconsin—like a society that abuses its poor—is not headed toward happy or productive times.

At this point in the devolution of the Fourth Turning, America can only increase social tensions—increasing the gradient of inequality across every dimension—until the breaking point of the old social order is reached, and work begins on forging a new consensus.

Friday, September 3, 2010

Visual interpretation of the unemployment number

If there is any relation between mean duration of unemployment and the subsequent drop in the unemployment rate, we are in for a very slow decline (if any) in the unemployment rate:

image

The following charts show the relationship between mean duration of unemployment and unemployment rate a year later, showing that the relationship has changed in this recession:

image

Using the fitted equation for the period 2007:1 to August 2010, we have a forecasted unemployment rate of 7.5 percent in August 2011.  This depends on a big ceteris paribus (other things equal) assumption about civilian labor force participation rate and other factors behaving the same in the recovery as in the recession.  If we use the line fitted to the whole sample, the forecasted unemployment rate is 10.2 percent, with a looser fit.

So let us assume unemployment remains unchanged for the next year.  What does that do to “animal spirits”?  We are interested because the distinguishing characteristic of an NBER-defined slump or a business slump as understood by any practical person is the associated failure of confidence; which, as Keynes pointed out, is a palpable entity to the practical person that is adequately proxied by survey measures.  And visual examination of the record (below) shows that every recession has been accompanied one-to-one by a failure of confidence as measured by the venerable Michigan sentiment series, and our measure, A.  I have assumed

Regular readers will recall that our proxy for the determinants of confidence is the relation of the unemployment rate to an adaptation level:

A = - (U – UMEAN)/sigma(U)

where A is “animal spirits.”

We are still not close to a failure of confidence; which is not to say the economy isn’t in an over-indebtedness-induced “underemployment equilibrium” exacerbated by a highly unequal distribution of income and wealth.  The next failure of confidence will probably not occur until about 2013.  For this forecast I assume the unemployment rate will fall for a year, stabilize, and begin to rise again:

image

If we assume the unemployment rate remains constant for two years and then begins to rise after the next Presidential election, we have this picture:

image

In the case above confidence never recovers to “positive” levels, but adaptation level effects are evident in that, even as unemployment rises to new highs, the plunge in confidence is not worse than before.  Plus ça change, plus c'est la même chose….

With regard to Hussman’s views on the yield curve noted recently, the 1/10 yield curve is still 2.5+ percent positively sloped, so any logistic yield curve model will still show very low recession probability (ours, of course, also utilizes the A variable; and in any event the effect of ZIRP will not be a distortive on the 1/10 curve as on the 3-month; and changes in the slope are still highly indicative):

image

The shape of the current cycle resembles the 1970-1974 abortive recovery, only worse. 

At some point I will write up some insights on “America on the hedonic treadmill” and the adaptive necessity of resetting adaptation level “set points” to survive what’s coming, but everybody already knows that we’re going to have to get by with less.  The primary contribution today is to put the current cycle in context along the most important dimension, that of “animal spirits” or confidence.  The next collapse is still a ways off.

Friday, August 27, 2010

Screwing labor for fun and profit (some more)

Via:  www.zerohedge.com channeling JP Morgan

"the latest profit recovery (the three red dots) is reliant on declining labor costs like none before it."


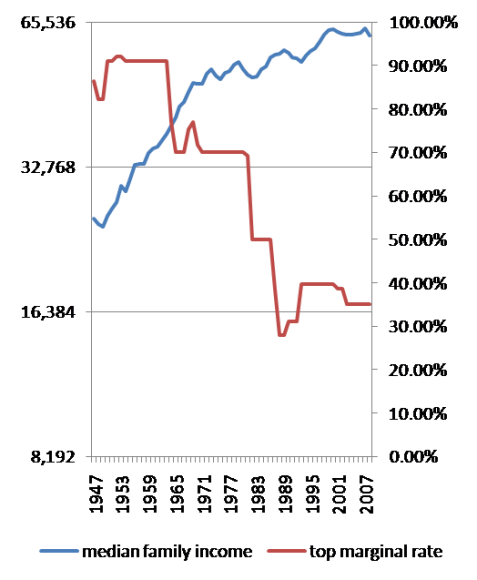
It will be disgusting beyond measure if the very slight increases in marginal tax rates on top 1 percent incomes (in historical context) coinciding with the lapsing of the Bush tax cuts are blocked by the ruling class.  Here again are top marginal tax rates in perspective (via Krugman):

Measnwhile, Yves Smith does a good job describing the SEC’s neutering of shareholder representation reforms. 

Via:  www.angrybear.com:

Plutocracy died with Obama’s election!  Long live Plutocracy!

Thursday, July 22, 2010

Cure poverty with money

The Benign Brodwicz program for the United Snakes of America is and always has been this:

  1. Give the unemployed a livable poverty level dole. 
  2. Provide universal public health care.  (The Bill Gates program for the bottom billion.)

Pay for the dole by raising marginal tax rates on our super-greedy, klepto-plutocracy, aka the American ruling class.

The following article from www.NewScientist.com provides support for my views.  America is as sick from this point of view as any banana republic.  But then, of course, we are one.

Die young, live fast: The evolution of an underclass

Editorial: Why biology should inform social policy

FROM feckless fathers and teenaged mothers to so-called feral kids, the media seems to take a voyeuristic pleasure in documenting the lives of the "underclass". Whether they are inclined to condemn or sympathise, commentators regularly ask how society got to be this way. There is seldom agreement, but one explanation you are unlikely to hear is that this kind of "delinquent" behaviour is a sensible response to the circumstances of a life constrained by poverty. Yet that is exactly what some evolutionary biologists are now proposing.

There is no reason to view the poor as stupid or in any way different from anyone else, says Daniel Nettle of the University of Newcastle in the UK. All of us are simply human beings, making the best of the hand life has dealt us. If we understand this, it won't just change the way we view the lives of the poorest in society, it will also show how misguided many current efforts to tackle society's problems are - and it will suggest better solutions.

Evolutionary theory predicts that if you are a mammal growing up in a harsh, unpredictable environment where you are susceptible to disease and might die young, then you should follow a "fast" reproductive strategy - grow up quickly, and have offspring early and close together so you can ensure leaving some viable progeny before you become ill or die. For a range of animal species there is evidence that this does happen. Now research suggests that humans are no exception.

Certainly the theory holds up in comparisons between people in rich and poor countries. Bobbi Low and her colleagues at the University of Michigan at Ann Arbor compared information from nations across the world to see if the age at which women have children changes according to their life expectancy (Cross-Cultural Research, vol 42, p 201). "We found that the human data fit the general mammalian pattern," says Low. "The shorter life expectancy was, the earlier women had their first child."

But can the same biological principles explain the difference in behaviour between rich and poor within a developed, post-industrialised country? Nettle, for one, believes it can. In a study of over 8000 families, he found that in the most deprived parts of England people can barely expect 50 years of healthy life, nearly two decades less than in affluent areas. And sure enough, women from poor neighbourhoods are likely to have their babies at an early age and in quick succession. They have smaller babies and they breastfeed less, both of which make it easier to get pregnant again sooner (Behavioral Ecology, DOI: 10.1093/beheco/arp202).

In the most deprived parts of England, people can barely expect 50 years of healthy life - two decades less than in affluent areas

"If you've only got two-thirds as much time in your life as someone in a different neighbourhood, then all of your decisions about when to start having babies, when to become a grandparent and so on have to be foreshortened by a third," says Nettle. "So it shouldn't really surprise us that women in the poorest areas are having their babies at around 20 compared to 30 in the richest ones. That's exactly what you would expect."

Consciously or subconsciously, women do seem to take their future prospects into account when deciding when to start having children. At a meeting last year, Sarah Johns at the University of Kent in Canterbury, UK, reported that in her study of young women from a range of socioeconomic backgrounds in Gloucestershire, UK, those who perceived their environment as risky or dangerous, and those that thought they might die at a relatively young age, were more likely to become mothers while they were in their teens. "If your dad died of a heart attack at 45, your 40-year-old mum has got chronic diabetes and you've had one boyfriend who has been stabbed, you know you've got to get on with it," she says.

It's the same story in the US. The latest figures, from 2005, reveal that teenage motherhood accounts for 34 per cent of first births among African Americans - who are more likely to live in deprived areas - and 19 per cent among whites. Arline Geronimus of the University of Michigan at Ann Arbor, who has studied health inequalities and reproductive patterns, points out that healthy life expectancy is short for African Americans and women depend on extended family networks for support. This means it is in their interests to have children while they still have relatives in good physical shape to help out.

The shockingly rapid deterioration in health experienced by women in poor black neighbourhoods also directly affects mothers. Even women in their 20s have an increased risk of conditions such as hypertension that would reduce the chance of a healthy pregnancy and birth. In research carried out in the late 1990s, Geronimus and her colleagues found that in Harlem, a poor neighbourhood in New York City, the infant mortality rate for babies born to mothers in their 20s was twice that of the babies of teenage mums (Political Science Quarterly, vol 112, p 405). Geronimus thinks the situation may be even worse now, given that the rate of health deterioration in black women has increased in the past decade.

It is not simply a case of teenage girls from deprived backgrounds accidentally becoming pregnant. Evidence from many sources suggests that teen pregnancy rates are similar in poor and affluent communities. However, motherhood is a choice, as both Geronimus and Johns are keen to point out. Teenage girls from affluent backgrounds are more likely to have abortions than their less-privileged peers. In terms of reproduction, the more affluent girls are best off concentrating on their own career and development so that they can invest more in the children they have at a later stage. "It seems that girls are assessing their life chances on a number of fronts and making conscious decisions about reproduction," says Johns.

Another important issue is whether or not a girl's father is around when she is growing up. Developmental psychologist Bruce Ellis, of the University of Arizona in Tucson, has studied extensively the effects of girls' relationships with their fathers. His research shows that the less involved a father is with his daughter from an early age, and the less warm the relationship, the earlier she starts having sex and, potentially, babies (New Scientist, 14 February 2007, p 38).

Fathers in deprived neighbourhoods are more likely to be absent, which could be because they are following "fast" strategies of their own. These include risky activities designed to increase their wealth, prestige and dominance, allowing them to compete more successfully with other men for sexual opportunities. These needn't necessarily be antisocial, but often they are. "I'm thinking about crime here, I'm thinking about gambling," says Nettle, and other risky or violent behaviours that we know are typical of men in rough environments. A fast strategy also means a father is less likely to stick with one woman for the long term, reducing his involvement with his children.

Paternal benefits

That is unfortunate, since a father's involvement not only delays his daughter's reproduction but also has a big impact generally on the life chances of his children. In a study of 17,000 people in the UK born in a single week in March 1958, Nettle found that where father involvement was greater, children had higher IQ scores at age 11 and increased upward social mobility through adulthood (Evolution and Human Behavior, vol 29, p 416).

Lower investment in children, whether it be through the absence of dad, less breastfeeding from mum, or less parental attention generally because there are more children in the family, comes at a high cost to the children themselves. For one thing, Nettle's large-scale study of families in England found that babies born in the poorest areas have slower cognitive development, which compromises their education and prospects later in life.

To all this you might ask the question, aren't poor people bringing their problems on themselves? If only they would wait a while before starting to have babies they might be able to invest more in each one, providing a better diet and healthier lifestyle. It is not so simple. "Children of low income, low education families don't do well regardless of what their parents' age is," says Johns. What's more, youngsters who delay parenthood may actually be worse off. "In a US study looking at pairs of low-income sisters, the ones that became mothers in their teens quite often did better [in terms of employment and earnings] because they had something to focus their energy into and create a better life for."

Nettle agrees: "Overwhelmingly the poverty into which a baby is born is going to be a big influence, whatever the age of the mother. It may be that there's not much pay-off for waiting and doing other, more middle-class behaviours that public health people want to encourage the poor to do."

People in deprived areas face two kinds of hazard, Nettle says. First, there are constraints on what they are able to do to mitigate their situation. Diet is a prime example: "It's much more expensive to get 2000 calories a day from fresh fruit and vegetables compared with eating junk food," Nettle says. Then the environment is often physically more dangerous and unhealthy. "People are doing more dangerous jobs. There is probably more air pollution, more car accidents, a higher crime rate, poorer housing - things you cannot really do much about, which trigger a downward spiral of faster living and less attention to health."

Once you are in a situation where the expected healthy lifetime is short whatever you do, then there is less incentive to look after yourself. Investing a lot in your health in a bad environment is like spending a fortune on maintaining a car in a place where most cars get stolen anyway, says Nettle. It makes more sense to live in the moment and put your energies into reproduction now.

Evolutionary theory can explain these behavioural responses to poverty, but it doesn't make them desirable. So what is the answer? What can be done to help people escape from the slippery slope of poor health, poor education and deprivation?

Governments are very good at being concerned about rates of teenage pregnancy and violence among young men, but Nettle argues that no amount of money poured into sex education and parenting classes will change the situation if young people don't see a decent future for themselves. To change behaviour we have to change the environment, which means that actually reducing poverty in the most deprived areas is likely to do a much better job than education schemes or handing out morning-after pills.

No amount of money poured into sex education and parenting classes will change the situation if young people don't see a decent future for themselves

Perhaps the most compelling evidence for this comes from real-life situations. In the mid-1990s, the residents of one poor, mainly Native American district in North Carolina each received a windfall in the form of royalties from a casino that had been built on their land. After the windfall, the researchers recorded a significant reduction in conduct disorder - the psychologist's term for antisocial behaviour - among the poorest children (The Journal of the American Medical Association, vol 290, p 2023).

On a larger scale, during the 1990s there was a dramatic decline in teenage birth rates in the US, especially among African Americans. In 1993, 6.4 per cent of black girls aged between 15 and 17 became first-time mothers but by 2000 this had dropped to 4.5 per cent (Social Science and Medicine, vol 63, p 1531). Geronimus puts this down in part to the strong economic expansion and increase in employment rates during this time, which offered young black women job opportunities they were unlikely to have had before. Teen births among African Americans are now rising again, predictably, given the recent economic nosedive.

It's all relative

Still, reducing poverty alone probably isn't the answer. In their book The Spirit Level (Allen Lane, 2009), epidemiologists Richard Wilkinson and Kate Pickett, of the universities of Nottingham and York, UK, respectively, emphasise the degree of income inequality in a society rather than poverty per se as being a major factor in issues such as death and disease rates, teenage motherhood and levels of violence. They show that nations such as the US and UK, which have the greatest inequality in income levels of all developed nations, also have the lowest life expectancy among those nations, the highest levels of teenage motherhood (see diagrams) and a range of social problems.

The effects are felt right across society, not just among poor people. "Inequality seems to change the quality of social relations in society," says Wilkinson, "and people become more influenced by status competition." Anxiety about status leads to high levels of stress, which in turn leads to health problems, he says. In unequal societies trust drops away, community life weakens and society becomes more punitive because of fear up and down the social hierarchy.

"Really dealing with economic inequalities is difficult because it involves unpopular things like raising tax," says Nettle. "So rather than fighting the fire, people have been trying to disperse the smoke." Politically it is much easier to pump money into education programmes even if the evidence suggests that these are, on the whole, pretty ineffective at reducing the effects of poverty.

There are two quite different ways that societies can be made more equal, Wilkinson says. Some countries, like Sweden, do it by redistribution, with high taxes and welfare benefits. In others, earnings are less unequal in the first place. Japan is one such country, and it has one of the highest average life expectancies and lowest levels of social problems among developed nations. Other important factors, says Wilkinson, are strong unions and economic democracy.

The bottom line, if young people are to avoid being channelled into a fast reproductive strategy with the disadvantages that this entails, is that they should have the chance to develop a longer view - through better availability of jobs and health support. They need reasons to believe they have a stake in the future.

Mairi Macleod is a journalist based in Edinburgh, UK

Friday, June 4, 2010

Labor market remains very weak

 image

www.calculatedrisk.com offers the following:

Mean duration of unemployment continues to shoot up.  At this point it is almost irrelevant whether someone is in the labor force or not, as we know that income inequality is at record highs, asset prices have collapsed, so that those at the bottom of the pecking order are likely in need of work whether they’re counted in the labor force or not.  Employment/population is near 25-year lows.

Saturday, April 3, 2010

The state of the labor market

And remember that “employment” counts those involuntarily working part-time jobs and those imputed to be “self-employed.”  See Mish or Tyler Durden for demolition of the current unemployment statistics.

image

The U-6 measure of un- and underemployment hovers around 17 percent.  Given the extreme inequality of the income distribution, this represents a sizeable and growing underclass.  How much fun it will be to live in the United States over the next decade will be largely determined by how the authorities choose to deal with this segment.

The Obama administration is being vilified by some for trying to address a mounting humanitarian crisis here at home, much as Bill and Melinda Gates are being vilified by some on the left for “racist” eugenic ambitions for trying to improve the health of the bottom two billion humans (which, in turn, will predictably lead to lower infant mortality and lower reproduction rates). 

The ruling class loves the current nasty political environment because it keeps their marginal tax rates low.  My read is that the powers that be are aware the economy is collapsing and are making their last greedy grab for wealth to set themselves and their families up during the depression that will unfold in a few years.

Marginal tax rates on incomes over $1 million should be about 75 percent in the current fiscal environment. 

Saturday, February 6, 2010

The state of the labor market

image

The employment/population ratio has fallen while mean and median duration of unemployment has risen to levels previously unrecorded in the postwar period. 

Tuesday, October 27, 2009

Back to 1980, when the glorification of greed began

The unemployment rate is approaching peaks not seen since the Carter-Volcker-Reagan inflation-killing recession of almost thirty years ago, while the employment-to-population ratio is approaching lows not seen since then.  In the intervening years, America has become vastly more unequal in how it distributes its income and wealth.  This dynamic is like a giant scissors that is cutting the American social fabric in half—really, more like into one-tenth and the other nine-tenths.

image

Last time, the way that bottom-ninety-percent of Americans dealt with the problem was to increase labor force participation and employment.  The women went to work.  Because wages are sticky downward, and the un- and under-employment pool is approaching twenty percent of the labor force, the current collapse of effective demand is creating a class of neo-serfs who are experiencing steep declines in incomes.  Companies do not cut the pay of existing employees; they low-ball new hires.  You may be in this class, or one or more of your neighbors might be.

How to achieve a just distribution if corporations won’t do it, and government won’t raise taxes on the rich at this time of greatest-ever need of our government?  You can make gifts of up to $10,000 to anyone tax-free to them (it’s after-tax income to you).  Gifts to deserving kids trying to make it through college in these hard times might be especially worthwhile.

Monday, October 5, 2009

“Animal spirits” still poised to rise

Not because the fundamentals of the economy are better, but because people are becoming accustomed to the higher unemployment rates (rising adaptation level), some degree of confidence is returning to American consumers, although they are still in technically “depressed” territory because the current unemployment rate at 9.8 percent is above the current adaptation level of 6.4 percent.  Recall that my formula for imputed “animal spirits,” A, is

A = - (U – UMEAN)/Stdev(U)

over a recent four-year period, where UMEAN is an exponential weighted average.

image

Click on graphs for a larger image in new window

The primary distinguishing feature of this slump is the credit crisis.  But not everything is different this time, to coin a phrase.  “Animal spirits” still drive economic activity to a large degree, and inversions of the yield curve (perhaps as reflections of expectations) accurately signal “recessions” as defined by the NBER, what ordinary folk call business cycle slumps, troughs, depressions or panics.  My model predicted this past slump in 2006, and the previous recession in 2001, both at times when the majority of professional forecasters were predicting “no recession in sight.” 

So it is with a bit of irony that I report that my “animal spirits” plus slope of the yield curve recession forecasting model is saying “no recession in sight.”

image

That little blue squiggle near the zero line extending a year into the future represents the “probability of recession” over the coming year.  It is negligible, in the NBER-defined sense of recession.  The components of output they look at will probably turn upward and show positive growth rates.  Unemployment will continue to climb for about a year, and there will be no reform of the financial institutions that created this mess.  Wall Street is squarely to blame.  Barry Ritholtz and Andrew Ross Sorkin have books out that do a good job describing how.  Our entire monetary system is compromised, our financial markets manipulated at a prima facie level beyond dispute (e.g., Goldman Sachs and Morgan Stanley, now “banks,” can borrow at a zero interest rate from the Fed in a carry trade and turn around and speculate with taxpayer money); our Congress and President are totally flaccid in the grip of Big Money.

I expect, with others, that the United State of America is heading toward a major crack-up that will change the way we live permanently.  Whether the rich and their mercenaries take over the country and subject the rest of the populace to a form of neo-feudal servitude (likely the result here and in China), or whether there will be a splitting up of the American states (unlikely), or whether there will be a “revolution” and a new government put in place (possible), who knows?  But the additions to debt that Congress and the President are blithely talking about—coming on top of existing indebtedness—will bankrupt the US and destroy the value of its currency, so a hand-to-mouth existence for many is entirely possible.

As Proverbs says,

He who oppresses a poor man insults his Maker,
but he who is kind to the needy honors him.

The fate of America depends largely on the wisdom of the wealthy, who have feathered their nests so well since Reagan (symbolically, at least) began the movement toward false wealth (debt) for the majority, lower taxes and massive worldly wealth for the tiny upper crust.  It is the now-inbred arrogance of the American “aristocracy” (oligarchy?) that makes me think the best near-term remedy for what ails us would be to raise marginal tax rates on incomes over a million dollars to something like 75 percent—to bring these knuckleheads down to earth and make them realize they breathe the same air the rest of us do.  Man up, Congress!  Man up, Mr. President!  And this is coming from a quasi-libertarian classical liberal!  There is no escaping the state; there will always be a state; the question is what do we want it to do.

I still expect a greater collapse to come after the next Presidential election, in about 2014.  It may come with war.  Our Federal Reserve is on record stating that some inflation would be good for us.  But they have the problem that excessive debt, debt that doesn’t get repaid, causes deflation, not inflation, as we’ve seen in real estate.  Historically, a hot war is the best way to get an inflation going.  The secret hope of the Federal Reserve is that the rest of the fiat money central banks in the world, many in as bad shape as ours, inflate more quickly than we do, causing our currency to retain relative value. 

This will be the final supernova of Bretton Woods II, pure fiat money with no backing.

But it will take a long time to get an inflation going, easily five years, I would guess.  We could continue to have deflation in some major asset prices like houses while experiencing inflation in day-to-day consumer prices like food and energy.

In other developments, labor market volatility, which serves to soften the blows of rising unemployment when volatility is rising, and to amplify the psychological effects of small increases of unemployment when volatility is very low, as it was early in this decade—labor market volatility will peak around yearend 2010 and begin a steep decline.

image

“Animal spirits,” in turn, will “go positive” a year later, about the beginning of 2012.  The sense of a stabilizing labor market will be strong.  If this occurs as forecast, it will herald a time of seeming happiness (that Shakespearean “seeming” is added because I don’t think people will really believe it).  It may be quite euphoric and strange.

“Animal spirits” will peak in early 2013 shortly after the president’s inauguration.  Then “animal spirits” and the economy will probably drop like a rock as the federal debt binge and drying up international credit squeeze the last drop of effective demand out of American households.  By rights, this should be a deflationary collapse because it will be caused by too much debt.  As I say, I think it will take a hot war to get a general inflation going.  In passing, I note that when you have a carry trade in a quantitatively-eased currency, the Big Money can create spot inflations and hyper-inflations in commodities or paper assets at will, as happened with commodities last year.  Certainly the sharpies are keeping an eye on oil, as a little trumped-up panic about the stability of the Middle East could create a situation they could play going up and coming down.

I do believe that our thoughts have power, not only on other people, but in the physical world.  Lynn McTaggart’s wonderful books provide an introduction to the now three or four decades of scientific research on such topics.  It is necessary for the mass of humankind to pray for the new aristocrats, the oligarchs, who bestride the globe with their unimaginable wealth and their plans for the rest of us.  Let’s all pray that they come back down to earth, that they realize that it is not they who are going to determine what our rights are, but a power far higher than we or they. 

For the love of money is the root of all evils; it is through this craving that some have wandered away from the faith and pierced their hearts with many pangs.

Peace.

Thursday, September 17, 2009

What it’s like in China today

First-rate video journalism.  China has seen 20 million migrant workers from the countryside lose their jobs in the past year and slip away back into the countryside.  Factory owners seem typically to run away leaving only a paper notice that the business has closed.  Stratfor has opined that disparities between city and countryside are the Achilles heel of the Chinese polity, and this video confirms that social unrest may be rising in the form of greater demands for “human rights.”  Workers from the countryside are alleged to “forfeit their civil rights” when they migrate to the cities.  As with America, the problem of collapse of effective demand is distributional in the near term.  How is Chinese capitalism any different from the American variant, and why should the tendency toward neo-feudalism be any less--if not pronouncedly greater?  This is the problem posed by “the end of history,” or the “triumph” of neo-liberal-conservative sometimes “democratic” capitalism.

Growth theory tells us that a dollar or Yuan saved is not necessarily lost to final demand—it may be spent on capital formation.  The Chinese need only to use their savings internally instead of loaning them to us to achieve massive amounts of capital formation.  The government is firing up big infrastructure programs to do just that, while blowing some of its other bucks on energy and resource deals worldwide while the greenback is still worth anything.

I taught in Taiwan about a dozen years ago in an executive MBA program.  The buzz in that part of the world then was incredible.  I was surprised at the attitude of the Taiwanese toward the mainland, which at that time was beating up on Taiwan verbally pretty badly, with all kinds of threats of taking them over. 

“We are all Chinese,” they said. 

Thursday, September 10, 2009

Consumption stabilizing at 2006Q4 levels

image

Data monthly to July.  With Total Capacity Utilization at 69 percent and still very high levels of uncertainty in the financial markets, it is difficult to see investment spending adding much of a kicker to aggregate demand.  The political will for much additional government stimulus spending appears to be lacking.  Net exports are constrained by economic weakness abroad.  Consumption spending will continue to be depressed by increased saving and additions to the ranks of the unemployed, especially those not covered by unemployment insurance, and shrinking overall employment.  Hence, an L-shaped recovery appears likely in the intermediate term.  A further debt-deflationary collapse may follow in about five years.

image

As measured by the BLS, inflation appears to have returned to an Oh-Oh Decade trend rate of ~2.5 percent.  Declining value of the dollar will put pressure on inflation through import prices, constraining physical demands and further discouraging investment.

clip_image002[7]

Monday, September 7, 2009

Labor Day 2009 by the numbers

Via:  Economic Policy Institute  A statistical picture of a nation with a broken social contract. 

Labor Day by the numbers
By Anna Turner

September 7, 2009 | An EPI Fact Sheet

compiled by Anna Turner

Note that all numbers are current as of September 4, 2009.

TOTAL JOBS LOST DURING THE RECESSION: 6.9 MILLION

• New jobs needed per month to keep up with population growth: 127,000
• Jobs lost in August 2009: 216,000
• Jobs needed to regain pre-recession unemployment levels: 9.4 million
• Manufacturing jobs lost since the start of the recession: 2.0 million (14.6% of sector's jobs)
• Construction jobs lost in the recession: 1.4 million (19%, nearly one in five construction jobs)
• Mass layoffs (50 or more people by a single employer) in July 2009: 2,157; jobs lost: 206,791

UNEMPLOYMENT RATE: 9.7%

• Number unemployed: 14.9 million  (up from 7.5 million in December 2007)
• Underemployment rate: 16.8%; Share of workers un- or underemployed: roughly 1 in 6
• Under- and unemployed, marginally attached and involuntary part-time workers: 26.4 million
• Unemployment rate, ages 16 to 24: 18.2%
• Male unemployment: 10.9%; female unemployment: 8.2%
• White unemployment: 8.9%; black unemployment: 15.1%; Hispanic unemployment: 13%
• Unemployment rate, young college graduates: 5.9% (2nd worst on record); Worst recorded unemployment rate for young college graduates: 6.2% (1983)
• Traditional ratio of young college grads' unemployment to overall rate: 50%; Current ratio: 70%
• Portion of unemployed who have been jobless more than six months: one third
• Average weekly unemployment benefit in July (including additional $25 per week from the American Recovery and Reinvestment Act): $332

STATES WITH DOUBLE-DIGIT UNEMPLOYMENT IN JULY, 2009: 16; WHEN THIS LAST HAPPENED: 1983

• Highest unemployment rate: Michigan, 15.0%; lowest: North Dakota, 4.2%
• When California's Hispanic unemployment surpassed black unemployment: 2nd quarter, 2009
• Projected African American unemployment for Michigan, 2nd quarter of 2010: 24.9%

INCREASE IN AVERAGE U.S. WORKER'S PRODUCTIVITY, 2000-07: 19.2%

• Decrease in all prime-aged worker's real median weekly wages, 2000-2007: $1; Decrease for African Americans: $3
• Annual growth rate of private-sector workers' wages, last three months: 2.6%
• Annual growth of wages in managerial, professional, and related occupations, 2009, 2nd quarter: 0%
• Annual growth rate of real (inflation-adjusted), average, hourly wages since June 2000:  0.70%*
• Ratio of average CEO's pay to typical worker's pay in 1979: 27 to 1; Ratio in 2007: 275 to 1

EXPECTED NEW SPENDING (12-MONTHS) FROM THE NEW $7.25 MINIMUM WAGE: $5.5 BILLION

• Share of minimum wage workers with high school diploma in 1979: 57.5%: Share in 2008: 72%
• Workers getting a raise from latest minimum wage increase: 4.5 million
• Share of affected workers with annual family income below $35,000: 57.1%;  Share working at least 20 hours a week: 81.6%
• Extent to which the minimum wage's real value is lower than in 1968: 17%

AMERICANS UNINSURED IN 2007:  45 MILLION

• Drop in children covered through parents' employers, 2000 to 2007: 3.4 million
• Share of people under 65, with incomes in the top 20%, covered by employers in 2007: 86.4%; Share with incomes in the bottom 20%, covered by employers: 21.9%
• Share of Hispanic workers who are uninsured: 39.8%
• Percentage of under-65 Americans with employer-sponsored health insurance in 2000: 68.3%; In 2007: 62.9%
• Average monthly cost of COBRA with American Recovery and Reinvestment Act subsidy: $370; Without American Recovery and Reinvestment Act subsidy: $1,057
• Rise in out-of-pocket spending for the 1% of adults with the greatest medical expenses, 2004-2007: 42%
• Increase in health care premiums since 1999: 119%
• Amount by which U.S. private health insurance administrative costs exceeded all Canadian national health spending in 2007: $25 billion**
• Share of total U.S. health care costs paid by private insurers in 2007: 35%
• Share of total health care costs paid by U.S. government in 2007: 46%

SHARE OF PEOPLE NEAR RETIREMENT AGE WITH A 401(K) BALANCE UNDER $40,000 IN 2007: 50%

• Percentage of amount needed to maintain living standards that is held by average 401(k) participant approaching retirement: 20-40%
• Share of 401(k) assets estimated to be lost since 2007: 29%

WORKPLACES WITH NO CONTRACT MORE THAN THREE YEARS AFTER ELECTION IS WON: 25%

• Share of employers that interrogate workers in mandatory one-on-one meetings, 1999-2003: 63%; Share of employers that threaten workers in such meetings, 1999-2003: 54%
• Increase in likelihood that firm will fail if unionized: 0%
• U.S. manufacturing workers ranking on "value-added per employee," compared to 16 nations with higher compensation: 2

ANNUALIZED RATE OF ECONOMIC CONTRACTION, 2nd QUARTER, 2009: 1%

• Likely size of this contraction without the American Recovery and Reinvestment Act: 3-4%
• Jobs lost with the American Recovery and Reinvestment Act, 2nd quarter, 2009: 1.3 million
• Jobs that would have been lost without the American Recovery and Reinvestment Act, 2nd quarter, 2009: 1.8 million at least***

* EPI analysis of CPS and BLS data
**EPI analysis of HHS CMS, OECD, and World Bank data
***Mark Zandi, Moody's Economy.com

Sunday, August 9, 2009

It’s the debt, stupid (reprise)

Via:  Comstock Partners 

Check out the charts.  Only when viewed in the this context can one understand the scale of the criminality of the financial institution bailouts that put the bad debt (bad bets) of financial speculators on the backs of the American taxpayers.  This is all stuff regular readers have heard before, but Comstock does a really nice job on it.

I expect this house of cards to collapse within five or so years in unprecedented defaults that will of necessity be upon private debts.  This implies further asset price deflation in the U.S., probably of both real estate and stock prices. 

The monetary and fiscal authorities can be expected to “panic” again (really, they just realize that they have no choices, that all their moves are forced moves, forced by the financial-military-industrial complex and its ownership of the government).  It might well be agreed that, historically, the quickest way to get an inflation going to reduce the government’s debt is to have a hot war.  The chances of a U.S.-initiated war starting in the next decade are pretty good.  A rapid inflation could ignite.  So could a world war, over oil resources, perhaps. 

God save us from our leaders, and our greed.

Deleveraging the U.S. Economy
Total Credit Market Debt as a % of GDP
H/H Debt relative to Disposable Income
Savings Rate
Personal Consumption vs. GDP
H/H Debt vs. GDP
Credit Conditions
Capacity Utilization
Net Worth

We are in the process of deleveraging the most leveraged economy in history.  Many investors look at this deleveraging as a positive for the United States.  We, on the other hand, look at this deleveraging as a major negative that will weigh on the economy for years to come and we could wind up with a lost couple of decades just as Japan experienced over the past 20 years.  It is true that Japan didn't act as quickly as we did but our debt ratio presently is much worse than Japan's debt ratios throughout their deleveraging process. 

Presently, the stock market is exploding to the upside, which you could say argues against the case we are attempting to make in this special report.  However, if you step back and look at the larger picture, you can see that the stock market is still down over 35% from the highs reached in 2007 and also down over 33% from the highs reached in early 2000.  In fact, the market now is acting in the same manner as it did in early 2000 at the peak of the dot com bubble and again in 2006 & 2007 at the combined housing and stock market bubble. 

This seems to us to be a "mini bubble" of stocks reacting to an abundance of "money printing" by governments all over the world since stocks are rising worldwide.  Of course, if the U.S. doesn't recover there will be no worldwide recovery since the rest of the world is still dependent upon the U.S. consumers' appetite for their goods and services (despite the so called growth of domestic consumption in China and India).   We, however, don't believe that the U.S. massive stimulus programs and money printing can solve a problem of excess debt generation that resulted from greed and living way beyond our means.  If this were the answer Argentina would be one of the most prosperous countries in the world.  This excess debt actually resulted from the same money printing and easy money that we are now using to alleviate the pain.

Most investors believe the bailouts, stimulus plans, and quantitative easing will lead to inflation.  In fact, almost all of the bearish prognosticators are negative because of the fear that interest rates will rise once the inflation starts to work its way into the economy.  They point to the doubling of the monetary base which they believe will soon lead to rising prices as more dollars are created chasing the same amount of goods.  We, on the other hand, are not as concerned about the doubling of the monetary base because we believe the excess money will need the money multiplier and increases in velocity in order to increase aggregate demand and eventually inflation.  As long as velocity (turnover of money) is stagnant we expect the increases in the monetary base and all the quantitative easing will lead to a stagnant economy and deflation until the consumer goes into the same borrowing and spending patterns that was characteristic of the 1990s through 2007.  

Remember, over the past decade (when we believe the secular bear market started) the total debt in the U.S. doubled from $26 trillion in 2000 to just over $52 trillion presently (peaking a few months ago at $54 trillion).  This consists of $14 trillion of gross Federal, State and Local Government debt and $38 trillion of private debt.  We expect the private debt to continue declining in the future as the deleveraging of America unfolds, while the government debt will very likely explode to the upside as the government tries to slow down the private deleveraging by helping out the entities and individuals in the most trouble with debt (such as over-extended homeowners).    

We wrote a special report in January of this year titled "Substituting Debt for Savings and Productive Investment" in which we explained why the U.S. economy historically prospered because of hard working Americans saving a substantial amount of their income which was used for productive investment.  Unfortunately, all of this changed over the past few decades and got worse over the past decade.  In fact, we stated in the report that it took $1.50 of debt to generate $1 of GDP in the 1960s, $1.70 to generate $1 of GDP in the '70s, $2.90 in the '80s, $3.20 in the '90s, and an unbelievable $5.40 of debt to generate $1 of GDP in the latest decade.  Over the past two decades, while most investors thought this trend could continue indefinitely, we have been warning them of the catastrophic problems associated with this ballooning debt. 

The attached chart of total debt relative to GDP shows exactly how much debt grew in this country relative to GDP (it is now 375% of GDP).  The total debt grew to over $52 trillion relative to our current GDP of approximately $14 trillion.  This is worse than the debt to GDP relationship in the great depression (even when the GDP imploded) and greater than the debt to GDP that existed in Japan in 1989.  Even if you took the debt to GDP when the U.S. entered the secular bear market in early 2000 and compared that to 1929 and Japan in late 1989, our debt to GDP still exceeded both (by a substantial margin relative to 1929).  The approximate numbers at that time were about 275% in the U.S. in early 2000, 190% in 1929, and about 270% in Japan in 1989. 

In fact, the similarities between Japan's deleveraging and the U.S. presently are eerie.  Japan's total debt to GDP increased from 270% when their secular bear market started to just about 350% 7 years later (1998) before declining to 110% presently.  The U.S. increased their total debt to GDP from 275% of GDP when our secular bear market started (in our opinion) to 375% presently (10 years later), and we suspect the total debt to decline similar to Japan's even though the Japanese government debt tripled during their deleveraging.  The government debt relative to GDP was about 50% in both the U.S. and Japan when the secular bear market started.  We also suspect that our government debt will grow substantially just like it did in Japan as the private debt collapses.  Also, the Japanese stock market doubled during the three years preceding their secular bear market in 1987, 1988, and 1989 while the U.S. market also doubled during the three years preceding the beginning of our secular bear market in 1997, 1998, and 1999. 

There also a few significant differences between the U.S. and Japan.  The private debt in Japan was almost the reverse of the U.S. where most of our excess debt was in the household sector and most of the excess debt in Japan was in the corporate sector.  The debt to GDP figures in Japan were not easy to come by from the typical sources until the mid 1990s and had to be estimated, but should be pretty close to the numbers used above.  Our sources on the above Japanese debt figures came from Ned Davis Research and the Federal Reserve Bank of San Francisco. NDR's report, "Japan's Lost Decade-- Is the U.S. Next?" have great statistics and information and the Fed's report "U.S. Household Deleveraging and Future Consumption Growth" is well worth reading.

The Fed study charted the peak of the debt related bubble of the stock and real estate assets in Japan in 1991 (1989 for stocks and 1991 for real estate) and overlaid it with the peak of U.S. debt associated with the same assets in 2008.  They concluded that if we are able to liquidate our debt at the same rate as Japan we would have to increase our savings rate from the present 6% (artificially high due to the recent stimulus paid to households) today to around 10% in 2018.  If U.S. households were to undertake a similar deleveraging, the collective debt-to-income ratio which peaked in 2008 at 133% (H/H debt vs. Disposable Personal Income) would need to drop to around 100% by 2018, returning to the level that prevailed in 2002.

If the savings rate in the U.S. were to rise to the 10% level by 2018 (following the Japanese experience), the SF Fed economists calculate that it would subtract ¾ of 1% from annual consumption growth each year.  We did a weekly comment about this very subject on June 25 of this year and came to a similar conclusion.  In that same report we showed that from 1955 to 1985 that consumption accounted for around 62% of GDP.  Because of the debt driven consumption over the past few years at the end of March 2009 consumption accounted for over 70% of GDP.  If the percentage dropped to the normal low 60% area of GDP it would subtract about $1 trillion off of consumption (or from $10 trillion to $9 trillion).  We also showed in that same report that H/H debt averaged 55% of GDP over the past 55 years and was 64% as late as 1995.  It has since soared to over 100% of GDP giving a big boost to spending that will be reversed as the deleveraging takes place over the next few years.

Other problems we have in the U.S. that will exacerbate the deleveraging are excess capacity, unemployment rates skyrocketing (putting a damper on wages), credit availability contracting, and dramatic declines in net worth.  The attached chart of capacity utilization is self evident that excess capacity in the U.S. has just dropped to record lows with the manufacturing capacity dropping to under 65% and total capacity utilization is just a touch better at 68%.  It is very hard to imagine corporations adding fixed investment at this time.  With unemployment rates close to 10% and rising, it is unlikely that wages will grow anytime soon.  The charts on credit availability and net worth reductions are self explanatory and will also put a damper on consumer spending rising anytime soon.

We expect that the U.S. deleveraging will follow along the path of Japan for years as real estate continues to decline and the deleveraging extracts a significant toll from any growth the economy might experience.  We also expect that, just like Japan, the stock market will also be sluggish to down during the next few years as the most leveraged economy in history unwinds the debt.   

Saturday, August 8, 2009

0 percent 10-year employment growth

Via:  NYT  According to data cited by Floyd Norris, the U.S. population has increased 10 percent or 28 million, from 279 million to 307 million, but employment growth has been flat.  (See the next chart for the actual employment series.)  And among those who have incomes, income inequality has grown sharply.  The next panic will probably be worse than the Panic of 2008.


image

To be fair here is the BLS Civilian Employment series according to FRED, which shows employment at November 2004 levels (note log scale).  The current slump has been the most proportionally damaging to employment in the postwar period.

image